
17. Complications of liver cirrhosis
Benjamin Maasoumy, Jonel Trebicka
Summary
This chapter deals with the development of complications in patients with end stage liver disease. Liver cirrhosis is the common in stage of any chronic liver injury. After a rather long period of compensated stage with increasing fibrosis and liver insufficiency, portal hypertension develops also progressively and drive complications. Especially development of collaterals including varices, as well as development of kidney dysfunction with the ascites are the most common complications of portal hypertension. Alongside with portal hypertension, a complex process of augmenting inflammatory state takes place, first limited to the liver and later taking over the organism in the form of systemic inflammation. Both portal hypertension and systemic inflammation drive decompensation, with this maximal form acute on chronic liver failure (ACLF), characterised by development of organ failures and very high short-term mortality. Despite substantial research work treatment options are limited to nonselective beta blockers, non-absorbable antibiotics, albumin, TIPS and liver transplantation.
Clinical stages and pathophysiology of liver cirrhosis
Liver cirrhosis is widely regarded as the final stage in the natural history of liver disease. However, complications and prognosis vary widely among the affected patients (D'Amico 2006, D'Amico 2018). In the past, patients have only been stratified into compensated and decompensated cirrhosis. However, this does not adequately reflect the complex pathomechanism and the wide variety of clinical phenotypes (Figure 1) (D'Amico 2018, Engelmann 2021). Modern classifications distinguish up to seven distinct stages in the natural history of cirrhosis (D'Amico 2018, Schulz 2024). In patients with compensated cirrhosis or compensated advanced chronic liver disease (cACLD), the development of portal hypertension plays a key role in disease progression and the development of clinical complications. Portal hypertension is defined by a portosystemic pressure gradient (PPG) of ≥6 mmHg (de Franchis 2022). However, the risk of associated complications, i.e. hepatic decompensation, remains negligible until a threshold of 10 mmHg is reached. This threshold indicates a so called clinical significant portal hypertension (CSPH) (de Franchis 2022, Jachs 2024a, Jachs 2024b). In the absence of CSPH and if the underlying liver disease has been adequately treated, patients do not necessarily require any specialised follow-up other than surveillance for hepatocellular carcinoma (HCC) due to the overall excellent prognosis (de Franchis 2022, Jachs 2024b, Semmler 2022). In contrast, those cACLD patients with CSPH should usually be followed by hepatologists for hepatic decompensation and may benefit from early treatment with non-selective beta-blockers (NSBB) even in the absence of large varices (Semmler 2021, Villanueva 2019). The gold standard for the diagnosis of CSPH in cACLD patients is the invasive transjugular assessment of the hepatic venous pressure gradient (HVPG). However, in the recent years several non-invasive alternatives have been established based on either elastography, blood tests (e.g. VITRO (Jachs 2023, Semmler 2024), 3P/5P model (Reiniš 2023, Sandmann 2023)) or a combination of different clinical and laboratory data (e.g. ANTIPICATE model (Abraldes 2016, Pons 2021)). BAVENO VII proposed criteria based on liver stiffness and platelets, which have been best validated for chronic hepatitis C and are able to diagnose or rule-out CSPH in about 50% of the patients (Abraldes 2016, Semmler 2022). Sequential application or combination of different non-invasive tests as well as the introduction of new techniques (e.g. spleen elastography) may reduce the grey zone in the future (Dajti 2022, Jachs 2023, Odriozola 2023) (Table 1). Validation will be required for different etiologies (including rare diseases) and different clinical situations (cured vs. ongoing liver disease) (Jachs 2024b, Sandmann 2023).
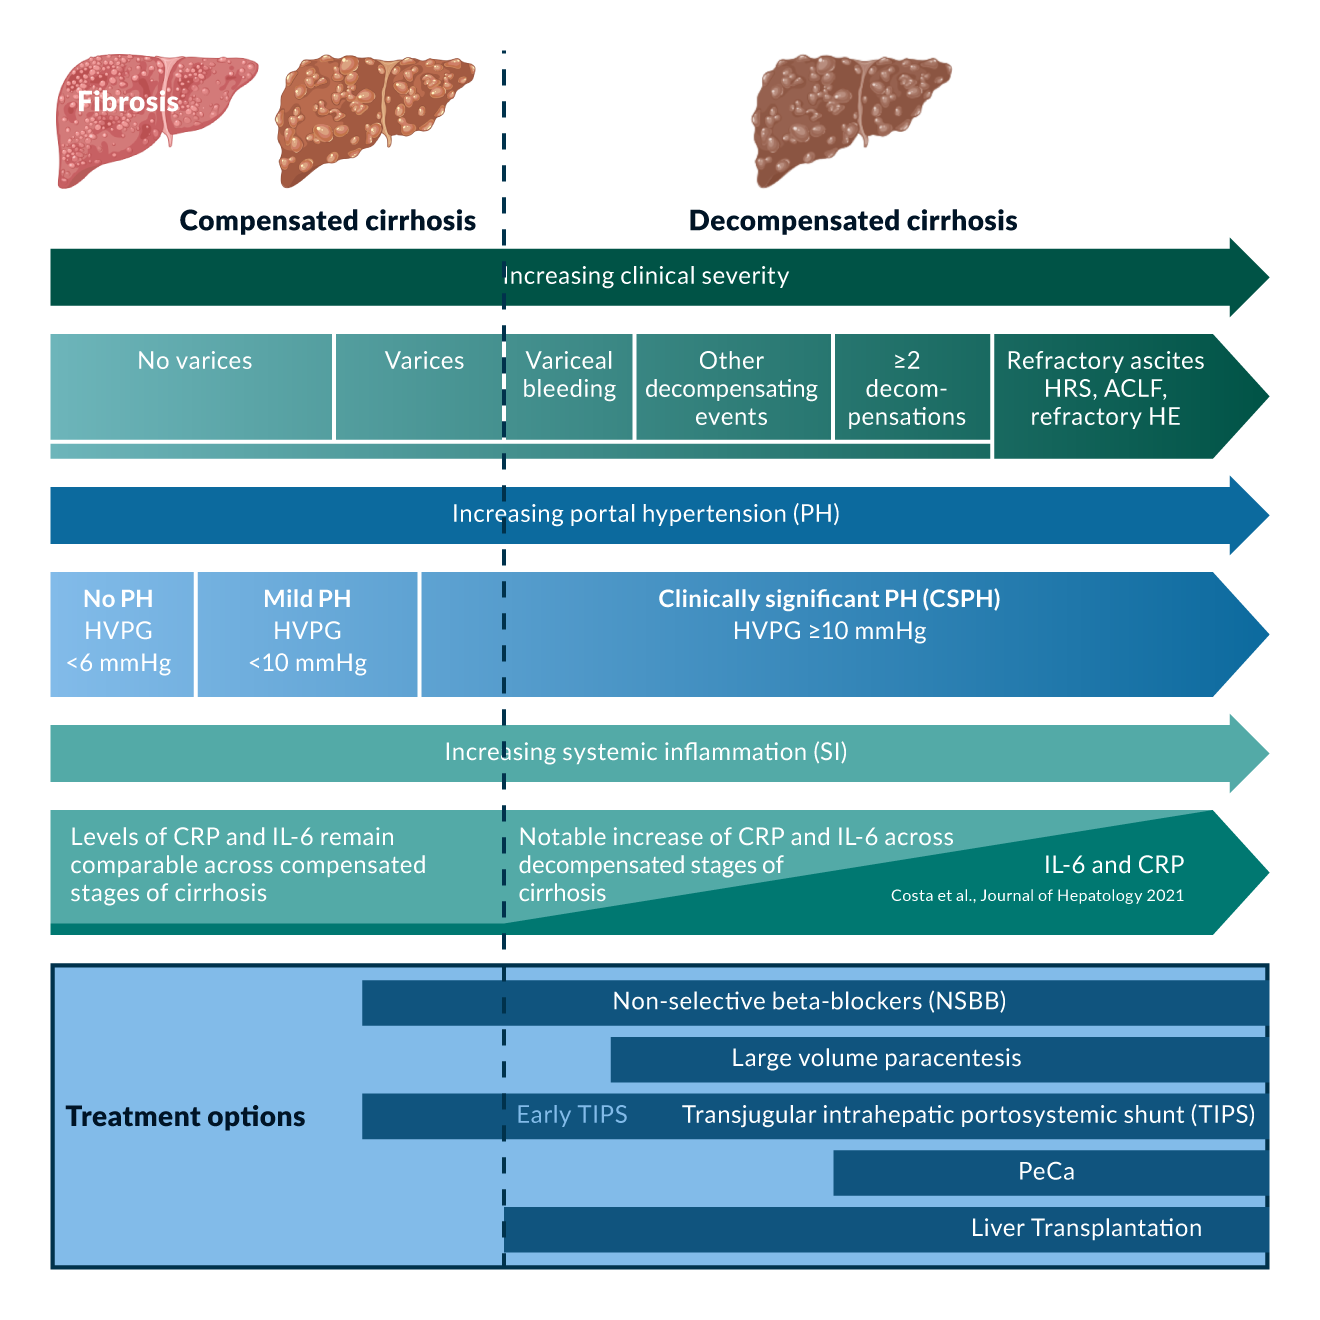 Figure 1. Modified after D'Amico et al., Journal of Hepatology 2018
Table 1. Selection of non-invasive tests (NIT) for the detection of clinically significant portal hypertension (CSPH)
Figure 1. Modified after D'Amico et al., Journal of Hepatology 2018
Table 1. Selection of non-invasive tests (NIT) for the detection of clinically significant portal hypertension (CSPH)
| NIT model | Required Parameters | Output Categories | Cut-off values (if available) |
| ANTICIPATE1 ANTICIPATE NASH2 |
LSM + PLT LSM + PLT + BMI |
CSPH probability (%) CSPH probability (%) in obese MASLD/MetALD patients |
|
| Baveno VII3 | LSM + PLT | CSPH ruled-out, Grey zone, CSPH ruled-in | CSPH Ruled out: LSM ≤15 kPa + PLT ≥150x109/L CSPH Ruled in: LSM ≥25 kPa particularly validated for patients with virus- and/or alcohol-related cACLD and non-obese (BMI <30 kg/m2) NASH-related cACLD |
| + VITRO4 | LSM + PLT + VWF/PLT ratio | CSPH ruled-out, Grey zone, CSPH ruled-in | Baveno VII + CSPH Ruled out: VITRO ≤1.5 CSPH Ruled in: VITRO ≥2.5 |
| + Spleen stiffness measurement (SSM)5 | LSM + PLT + SSM | CSPH ruled-out, Grey zone, CSPH ruled-in | CSPH Ruled out if at least two of the following present: LSM ≤15 kPa; PLT ≥150 x 109/L; SSM ≤ 40kPa CSPH Ruled in if at least two of the following present: LSM >25 kPa; PLT <150 x 109/L; SSM > 40kPa |
| 3P Model6 | PLT + Bilirubin + INR | CSPH probability (%) | |
| 5P Model6 | PLT + Bilirubin + APTT + CHE + Gamma GT | CSPH probability (%) |
Citations
1: Abraldes JG, Bureau C, Stefanescu H, Augustin S, Ney M, Blasco H, Procopet B, Bosch J, Genesca J, Berzigotti A; Anticipate Investigators. Noninvasive tools and risk of clinically significant portal hypertension and varices in compensated cirrhosis: The "Anticipate" study. Hepatology. 2016 Dec;64(6):2173-2184. doi: 10.1002/hep.28824. Epub 2016 Oct 27. Erratum in: Hepatology. 2017 Jul;66(1):304-305. doi: 10.1002/hep.29201. PMID: 27639071.
2: Pons M, Augustin S, Scheiner B, Guillaume M, Rosselli M, Rodrigues SG, Stefanescu H, Ma MM, Mandorfer M, Mergeay-Fabre M, Procopet B, Schwabl P, Ferlitsch A, Semmler G, Berzigotti A, Tsochatzis E, Bureau C, Reiberger T, Bosch J, Abraldes JG, Genescà J. Noninvasive Diagnosis of Portal Hypertension in Patients With Compensated Advanced Chronic Liver Disease. Am J Gastroenterol. 2021 Apr;116(4):723-732. doi: 10.14309/ajg.0000000000000994. PMID: 33982942.
3: de Franchis R, Bosch J, Garcia-Tsao G, Reiberger T, Ripoll C; Baveno VII Faculty. Baveno VII - Renewing consensus in portal hypertension. J Hepatol. 2022 Apr;76(4):959-974. doi: 10.1016/j.jhep.2021.12.022. Epub 2021 Dec 30. Erratum in: J Hepatol. 2022 Jul;77(1):271. doi: 10.1016/j.jhep.2022.03.024. PMID: 35120736; PMCID: PMC11090185.
4: Jachs M, Hartl L, Simbrunner B, Bauer D, Paternostro R, Scheiner B, Balcar L, Semmler G, Stättermayer AF, Pinter M, Quehenberger P, Trauner M, Reiberger T, Mandorfer M. The Sequential Application of Baveno VII Criteria and VITRO Score Improves Diagnosis of Clinically Significant Portal Hypertension. Clin Gastroenterol Hepatol. 2023 Jul;21(7):1854-1863.e10. doi: 10.1016/j.cgh.2022.09.032. Epub 2022 Oct 14. PMID: 36244661.
5: Dajti E, Ravaioli F, Marasco G, Alemanni LV, Colecchia L, Ferrarese A, Cusumano C, Gemini S, Vestito A, Renzulli M, Golfieri R, Festi D, Colecchia A. A Combined Baveno VII and Spleen Stiffness Algorithm to Improve the Noninvasive Diagnosis of Clinically Significant Portal Hypertension in Patients With Compensated Advanced Chronic Liver Disease. Am J Gastroenterol. 2022 Nov 1;117(11):1825-1833. doi: 10.14309/ajg.0000000000001887. Epub 2022 Jul 21. PMID: 35973171.
6: Reiniš J, Petrenko O, Simbrunner B, Hofer BS, Schepis F, Scoppettuolo M, Saltini D, Indulti F, Guasconi T, Albillos A, Téllez L, Villanueva C, Brujats A, Garcia-Pagan JC, Perez-Campuzano V, Hernández-Gea V, Rautou PE, Moga L, Vanwolleghem T, Kwanten WJ, Francque S, Trebicka J, Gu W, Ferstl PG, Gluud LL, Bendtsen F, Møller S, Kubicek S, Mandorfer M, Reiberger T. Assessment of portal hypertension severity using machine learning models in patients with compensated cirrhosis. J Hepatol. 2023 Feb;78(2):390-400. doi: 10.1016/j.jhep.2022.09.012. Epub 2022 Sep 22. PMID: 36152767.
The progression of earlier stages of cirrhosis is directly correlated with the degree of portal hypertension (Costa 2021, Ripoll 2007). In the decompensated stage (dACLD), the absolute HVPG level becomes less important. Patients’ prognosis and morbidity are determined by hepatic impairment, the presence of extrahepatic complications of cirrhosis and systemic inflammation (Angeli 2018, Costa 2021, D'Amico 2018, Engelmann 2021, Trebicka 2020d).
Hepatic impairment may include inadequate liver detoxification as indicated by elevated bilirubin or ammonia levels. Both are associated with patient survival. Bilirubin is widely used and included in several prognostic scores (Table 2). The value of ammonia has been controversial in the past. Limitations include interlaboratory variation. Recently, promising results have been published when local upper limits of normal are considered for interpretation (Ballester 2023, Tranah 2022). Hepatic synthetic capacity could be assessed by either INR or albumin. Serum cholinesterase may also be of value in certain situations (Stockhoff 2022).
Table 2. Scores for disease severity assessment in liver cirrhosis| Score | Included parameters | Interpretation | Comment |
| MELD Score1 | Creatinine + Bilirubin + INR | Scores range from 6-40. | Predicts three-month survival in patients with liver cirrhosis. OPTN Score from 2002-2016. |
| MELD Na2 | Creatinine + Bilirubin + INR + Sodium (Na) | Scores range from 6-40. | Predicts three-month survival in patients with liver cirrhosis. OPTN score from 2016-2022. |
| MELD 3.03 | Creatinine + Bilirubin + INR + Sodium (Na) + Albumin + Sex | Scores range from 6-40. | Predicts three-month survival in patients with liver cirrhosis. Current recommendation from the OPTN since 2022. |
| Child-Pugh4 | Bilirubin + Albumin + Quick + Ascites + Hepatic encephalopathy | Scores range from 5-15. Child-Pugh class A (5-6 pts.), Child-Pugh class B (7-9 pts.), Child-Pugh class C (10-15 pts.) | Child-Pugh class correlate with one- and two-year patient survival. OPTN Score pre-2002. |
| CLIF-C AD5 | Age + WBC + Creatinine + INR + Sodium (Na) | Scores range from 0-100. CLIF-C AD ≥60: high risk (3-month mortality >30%) CLIF-C AD ≤45: low risk (3-month mortality <2%) | CLIF-C acute decompensation (AD) score predicts survival of patients with acute decompensation of cirrhosis who do not have acute-on-chronic liver failure (ACLF) |
Abbreviations
CLIF-C AD: Chronic Liver Failure Consortium Acute Decompensation; INR: International Normalised Ratio; MELD: Model for End-Stage Liver Disease; MELD Na: MELD score incorporating serum sodium; MELD 3.0: Updated MELD score incorporating sodium, albumin, and sex; Na: Sodium; OPTN: Organ Procurement and Transplantation Network; WBC: White blood cell count.
Citations
1: Kamath PS, Wiesner RH, Malinchoc M, Kremers W, Therneau TM, Kosberg CL, D'Amico G, Dickson ER, Kim WR. A model to predict survival in patients with end-stage liver disease. Hepatology. 2001 Feb;33(2):464-70. doi: 10.1053/jhep.2001.22172. PMID: 11172350.
2: Biggins SW, Kim WR, Terrault NA, Saab S, Balan V, Schiano T, Benson J, Therneau T, Kremers W, Wiesner R, Kamath P, Klintmalm G. Evidence-based incorporation of serum sodium concentration into MELD. Gastroenterology. 2006 May;130(6):1652-60. doi: 10.1053/j.gastro.2006.02.010. PMID: 16697729.
3: Child CG, Turcotte JG. Surgery and portal hypertension. Major Probl Clin Surg. 1964;1:1-85. PMID: 4950264.
4: Jalan R, Saliba F, Pavesi M, Amoros A, Moreau R, Ginès P, Levesque E, Durand F, Angeli P, Caraceni P, Hopf C, Alessandria C, Rodriguez E, Solis-Muñoz P, Laleman W, Trebicka J, Zeuzem S, Gustot T, Mookerjee R, Elkrief L, Soriano G, Cordoba J, Morando F, Gerbes A, Agarwal B, Samuel D, Bernardi M, Arroyo V; CANONIC study investigators of the EASL-CLIF Consortium. Development and validation of a prognostic score to predict mortality in patients with acute-on-chronic liver failure. J Hepatol. 2014 Nov;61(5):1038-47. doi: 10.1016/j.jhep.2014.06.012. Epub 2014 Jun 17. PMID: 24950482.
Various forms of hepatic decompensation (distinct cirrhosis-associated complications) can occur. However, the clinical and prognostic relevance differs between complications and also depends on the number of events, e.g. patients with a single event of variceal bleeding without ascites have a better outcome than those with ascites but without portal hypertensive bleeding (D'Amico 2014, D'Amico 2006). The current BAVENO VII criteria propose a distinction between first and subsequent hepatic decompensation. First hepatic decompensation could be either overt ascites, overt hepatic encephalopathy and/or variceal bleeding. Further decompensation is associated with higher mortality and is defined by the development of either a second decompensation event (ascites, encephalopathy or bleeding), jaundice, refractory ascites or hepatorenal syndrome (de Franchis 2022).
In the final stage of cirrhosis, systemic inflammation becomes an important part of the pathophysiology. CSPH is one of the key factors involved in this process. CSPH contributes to an impairment of the intestinal barrier ("leaky gut"). This leads to translocation of bacteria and bacterial compounds (pathogen-associated molecular patterns, PAMPs) (Trebicka 2021b). Hepatic and extrahepatic cell and tissue damage, such as that caused by underlying liver disease, leads to a systemic increase in damage-associated molecular patterns (DAMPs). PAMPs and DAMPs trigger the secretion of proinflammatory cytokines following systemic arterial vasodilation. This has the potential to further worsen portal pressure by increasing splanchnic and hepatic arterial inflow. However, this is limited by the cardiac capacity to compensate for the required hyperdynamic circulation (cirrhotic cardiomyopathy) (D'Amico 2018, Engelmann 2021) (Figure 2).
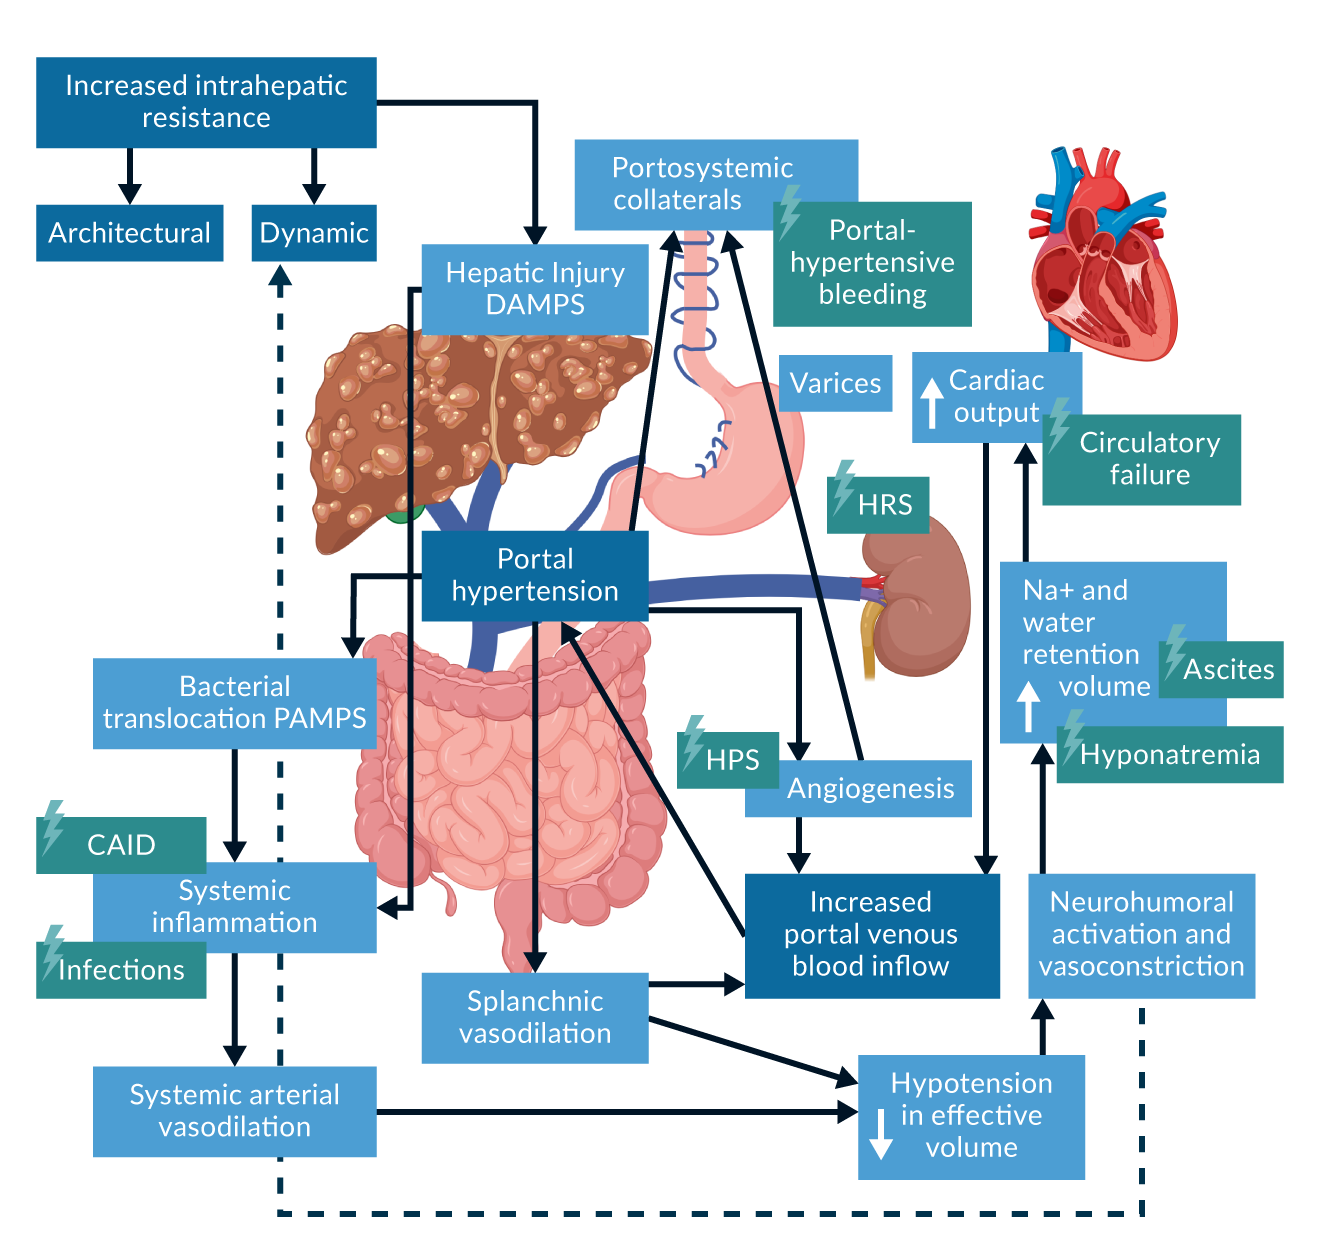 Figure 2. Adapted from Rodrigues et al., JHEP Reports 2020.
Pathophysiology and management of specific complications
Ascites
Clinical manifestation and relevance
Ascites is the most common event of first hepatic decompensation (18-48% of cases) (D'Amico 2018, Jepsen 2010, Planas 2004). The annual incidence in cACLD patients has been estimated to be 5-10% (Angeli 2018, Ginés 1987). It indicates a significant change in the natural history of liver cirrhosis with a dramatic increase in mortality (D'Amico 2006). Ascites is graded as mild (only detectable by ultrasound, grade 1), moderate (moderate abdominal distention, grade 2) and large (marked abdominal distention, grade 3) (Angeli 2018). While mild amounts of ascites are usually not associated with clinical symptoms, large amounts lead to significant morbidity. Clinical symptoms may include abdominal tightness, weight gain, loss of appetite, abdominal hernias and immobility. Ultimately, this leads to frailty, sarcopenia and a reduced health-related quality of life (HRQOL) (Hui 2024, Merli 2019). Small defects in the diaphragm can also accumulate in the pleural space as so-called hepatic hydrothorax, which can result in shortness of breath (Hui 2024).
Recurrent ascites is defined as ascites that occurs at least three times within 12 months. Refractory ascites is defined as ascites that cannot be mobilised despite adequate sodium restriction and diuretic treatment, either because of to non-response (diuretic-resistant) or intolerance of treatment (diuretic-intractable) (Angeli 2018, Arroyo 1996a). Refractory ascites indicates the final stage of liver cirrhosis and is linked to particularly poor survival (Salerno 1993, Tergast 2023, Tergast 2022). Therefore, patients with refractory ascites should be considered for liver transplantation (Angeli 2018).
Pathogenesis
Ascites is considered to be the consequence of CSPH, sodium and water retention as well as decreased oncotic pressure (Figure 3). CSPH and impaired venous drainage in portal system may increase capillary leakage and lead to drainage fluid into the abdominal cavity. Moreover, CSPH and inflammation results also leads to arterial vasodilation resulting in a decreased effective arterial blood volume. The physiological neurohumoral response to this is an activation of the renin-angiotensin-aldosterone system (RAAS) that mediates sodium and water retention in kidney. In the cirrhotic patient it will ultimately lead to sodium and water overload and is considered as the main driver of hydropic decompensation. Finally, impaired hepatic protein synthesis may contribute to ascites manifestation as the liver is the source of the majority of serum protein, in particular albumin.
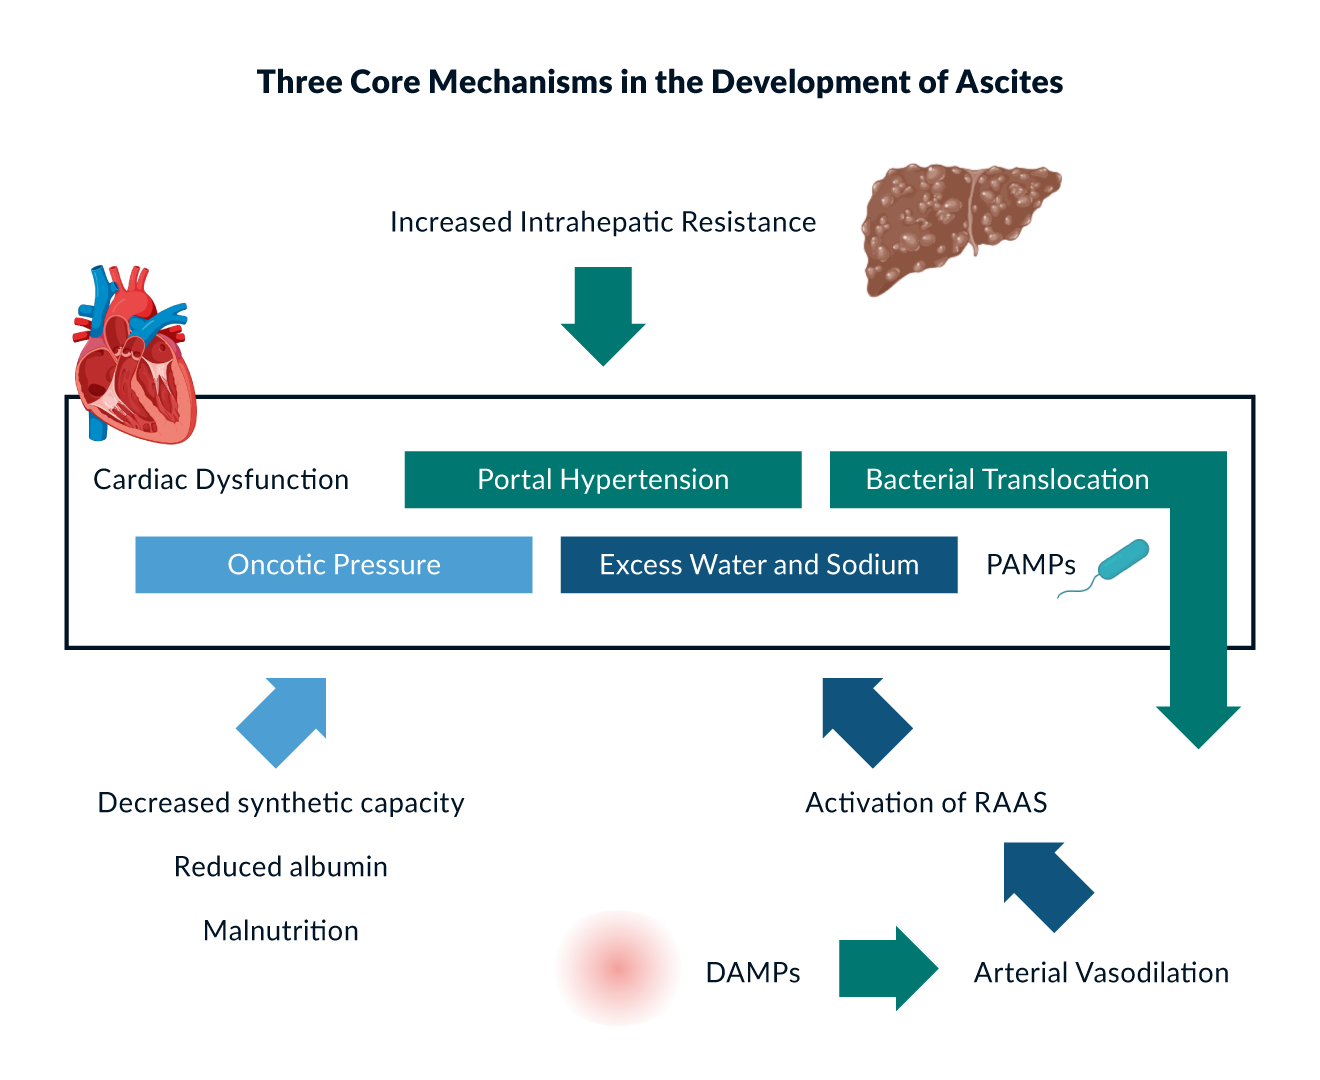 Figure 3. Adapted from Zakim and Boyers‘s Hepatology 6th edition; EASL „CPG decompensated cirrhosis”, J Hepatol 2018; Bhathal PS, et al. J Hepatol 1985; Rockey DC, et al. Gastroenterology 1998.
Diagnostic work-up
First ascites manifestation requires a structured diagnostic work-up, which usually includes a diagnostic paracentesis. While cirrhosis is certainly the most common cause of ascites, other differential diagnoses such as heart failure, intra-abdominal malignancy, portal vein thrombosis must be ruled out at this stage. The general appearance of the ascites can already lead to assumptions about its origin (e.g. if it is red or milky). In addition, total ascites protein and albumin should be determined. Albumin levels can be used to calculate the simple serum ascites albumin gradient (SAAG). Using a threshold of 1.1 g/dL, the SAAG is supposed to differentiate ascites due to portal hypertension from other causes in more than 95% of the cases (Runyon 1992). Low ascites protein levels support the suspicion of a classic transudate, e.g. due to CSPH, and levels below 1.5 g/dL indicate an increased risk for spontaneous bacterial peritonitis (SBP) (Guarner 1999, Llach 1992, Moreau 2018, Runyon 1986). Levels above 2.5 g/dL are suspicious for other causes of ascites (Runyon 1992). If malignancy is suspected, cytology should be performed on samples of at least 50-100 mL (Angeli 2018, Arroyo 1996b). Ascites level of cholesterol and carcinoembryonic antigen levels may be useful in case repeated cytology remains inconclusive (Angeli 2018, Gulyás 2001). After ascites has been attributed to liver cirrhosis and CSPH, subsequent episodes do not always require the same level of work-up. However, any worsening or new onset of ascites should raise the question of a possible precipitating event of hepatic decompensation (e.g., infection) that requires specific treatment (de Franchis 2022, Jalan 2014b, Moreau 2013).
Treatment
Therapeutic strategies are directly derived from the pathomechanisms discussed above and include nutritional, pharmaceutical and interventional measures. In general, a stepwise approach should be followed. However, presentation with grade 3 ascites may also justify direct initiation of combination therapy.
Nutrition
Sodium restriction is considered to be the treatment of choice in patients with ascites targeting the RAAS-induced retention of sodium and free water. However, overall efficacy is limited and a certain degree of natriuresis is required. Current EASL guidelines recommend limiting salt intake to 4.6-6.9 g per day (Angeli 2018). While more restrictive regimens may result in faster resolution of ascites, they are associated with impaired caloric intake and increased risk of renal failure. Moreover, it remains almost impossible for patients to follow such recommendations in their daily routine, as it is not possible to calculate the exact amount of salt in all meals. A more practical approach is to advise them not to add extra salt to their regular meals.
Fluid restriction is often used to treat ascites. However, its role is widely overestimated. In particular, there are no data that convincingly support its widespread use. In addition, fluid restriction has the same disadvantages as sodium restriction in terms of reducing overall caloric intake. At present, it is only recommended for severe hyponatraemia (<125 mmol/L) (Angeli 2018, Gerbes 2019).
In contrast, the importance of overall calory and in particular protein intake seems to be widely underestimated. Malnutrition and sarcopenia is frequent among cirrhotic patients and independently linked to an increased morbidity and mortality. In non-obese patients a calory intake of 30-35 kcal/kg body weight including 1-1.5g/kg body weight is indicated. This should be accompanied by late evening snack to avoid hypoglycemic and katabolic phases during the night, which provokes encephalopathy as well as further detoriation of sarcopenia and ascites (Merli 2019).
Diuretics
The first line of treatment is aldosterone antagonists, which directly target hyperaldosteronism and are superior to loop diuretics as monotherapy. Spironolactone is the most widely used drug and can be used up to a dosage of 400mg per day (Angeli 2018). Common side effects include hyperkalaemia, renal impairment and gynecomastia. In patients with severe gynecomastia, eplerenone can be used as an alternative and equally effective treatment. However, the approved dosage is limited to 50 mg/day. In case of inadequate response or severe ascites and/or hyperkalaemia on monotherapy, loop diuretics may be added (Angeli 2018). The dosage should be limited to the equivalent of 160mg of oral furosemide per day. Torasemide may offer a more favourable pharmacokinetic profile. However, there are no data to support that this translates into a superior outcome in cirrhotic patients. Combination therapy with spironolactone and loop diuretics is more effective, offers a better control of protassium levels, but is also more frequently associated with an excessive response with the need for dose reductions (Angeli 2010, Santos 2003). Treatment should be aimed at weight loss of 500-1000 g per day and should be adjusted after ascites control is achieved (Angeli 2018).
Large volume paracentesis (LVP)
In patients with refractory ascites, repeated LVP can be performed to control clinical symptoms. LVP is generally a safe procedure. Major bleeding is rare and routine assessment of the patient`s coagulation status is therefore not required (Lin 2005, Villa 2022). However, ultrasound guidance is recommended to avoid inadvertent punction of abdominal vessels. While, a maximum drainage volume has not been established, there is a certain risk of a circulatory dysfunction following LVP of more than 5 litres, as indicated by a decrease in mean arterial pressure, increase in aldosterone levels and the risk of acute kidney injury (AKI) (Ginès 1988). This can be prevented by albumin infusion of 6-8 g/L of removed ascites (Angeli 2018, Bernardi 2012, Sola-Vera 2003). However, the longer term administration of albumin in patients with severe ascites, requiring paracentesis, has been shown to improve survival (Caraceni 2018b).
Transjugular intrahepatic portosystemic shunt (TIPS)
TIPS insertion is the most effective treatment for CSPH after liver transplantation. Ascites control can be achieved in more than 70% of patients (García-Pagán 2020). A stent graft is placed through the jugular vein to create a bypass between a hepatic vein and a portal vein branch. This results in an immediate decrease in PPG, usually below the threshold of CSPH. Initially, there were some safety concerns due to a significant mortality rate and complications such as liver failure and encephalopathy (Lebrec 1996). Since then, significant benefits have been achieved, including technical safety, stent patency rates, and patient selection. In the past, TIPS malfunction was a common problem. However, this changed when bare metal stents were replaced by PTFE-coated stents (Bureau 2004). There has been a long-lasting debate as to whether TIPS is only a symptomatic treatment in patients with refractory and recurrent ascites. Finally, an individual patient meta-analysis (refractory ascites) and a well-designed randomised trial (recurrent ascites) convincingly demonstrated an improved survival compared to repeated LVP (Bureau 2017a, Salerno 2007). Thus, today, TIPS is considered the first-line treatment for patients with refractory or recurrent ascites (Angeli 2018, de Franchis 2022). The survival benefit underscores the ability of TIPS to alter the natural history of ACLD by curing CSPH, a major driver of disease progression. TIPS reduces the risk of further decompensation (Larrue 2023) and may prevent hepatic decompensation in patients with ACLD undergoing extrahepatic surgery (Piecha 2024). In addition, some studies suggest that there is a decrease in systemic inflammation after TIPS (Berres 2015, Kornfehl 2024, Tiede 2024), which is linked to an improved survival, ascites control and improvement of sarcopenia (Hey 2023, Kornfehl 2024, Tiede 2024). However, disadvantages need to be considered and patients must be carefully selected (García-Pagán 2020) (Table 3). The most discussed complication of TIPS may be hepatic encephalopathy. Spontaneous portosystemic shunts (SPSS) and their absolute size are linked to the risk of encephalopathy (Praktiknjo 2020a). Therefore, it seems obvious that this is also the case when TIPS is used as an iatrogenic shunt. In fact, the incidence of post-TIPS HE ranges from 35 to 50% (Bureau 2021, Ehrenbauer 2023, Montagnese 2022). While post-TIPS HE does necessarily increase mortality, it certainly does affect quality of life, in associated with rehospitalisation and is one of the most common reasons for the need of TIPS diameter reduction (Agrawal 2015, Gairing 2022, Nardelli 2024, Pereira 2016). Refractory or recurrent HE is usually considered as a contraindication for TIPS (Angeli 2018). However, the mechanisms of HE are complex and TIPS has both negative and positive effects in this regard (e.g. reduction of bleeding, inflammation and sarcopenia). Recent studies suggest that with fully covered stents and subsequently a marginal risk of dysfunction, the benefits and disadvantages of TIPS may even be balanced, as the HE incidence was not different from patients treated with LVP (Bureau 2017a). Overall, it remains difficult to predict the occurrence and course of HE after TIPS. Some authors stated that assessment for minimal HE may help to select patient selection (Berlioux 2014, Nardelli 2016). However, this has not been confirmed by others (Ehrenbauer 2023). More relevant seems to be the stage of liver cirrhosis as indicated by MELD, serum cholinesterase or the new Freiburg index of post TIPS survival (FIPS) (Bettinger 2021, Cai 2022, Stockhoff 2022). The use of stents with a smaller diameter can reduce the risk for post-TIPS HE (Schepis 2018, Wang 2018) . 8 mm instead of 10 mm is now widely considered as the standard of care, especially due to improved outcome (Trebicka 2019b, Praktiknjo 2021b). Treatment efficacy remains similar as long as a 50% PPG reduction is achieved (Queck 2023, Wang 2018). In high-risk patients underdilatation to 6 or 7 mm or a reduction of preexisting SPSS may be considered (Lv 2022, Praktiknjo 2021a, Schepis 2018). Recently, an individualised approach has been suggested. A PPG reduction of 60-80% was identified as the optimal target to maximise the chance of ascites control without increase in the incidence of Post-TIPS HE (Kabelitz 2025). Finally, primary prophylaxis with rifaximin significantly reduced post-TIPS HE in a recently published randomised controlled trial (Bureau 2021). While the risk of HE may be overestimated, many physicians tend to underestimate the risk for cardiac decompensation, which can be expected in 20% of patients (Billey 2019, Schneider 2023). Due to the newly introduced shunt, the cardiac index increases by approximately 50% (Huonker 1999), at least in the early phase after TIPS. Therefore, patients with significant cardiac impairment and moderate or severe pulmonary hypertension should not undergo TIPS insertion (Angeli 2018). In addition, the presence of aortic valve stenosis seems to be associated with a particularly high risk (Billey 2019). Different risk scores have been proposed in the past with varying degrees of prognostic accuracy. In general, the prevalence of diastolic dysfunction seems to be a valid parameter that is associated with the likelihood of decompensation (Billey 2019, Schneider 2023). Thus, echocardiography should be performed prior to TIPS. Smaller diameter stents may help to further reduce the risk of decompensation. TIPS results in reduced portal blood flow. In rare cases this can lead to hepatic infarction (Tuifua 2022). Insufficient arterial perfusion must be ruled out when evaluating patients for TIPS. However, the more common clinical challenge is the reduction of liver function leading to hepatic failure with progressive increase in bilirubin levels. High grades of intrahepatic inflammation, serum bilirubin, serum cholinesterase as well as low albumin levels have been associated with poor post-TIPS survival (Bettinger 2021, Bureau 2011, Stockhoff 2021, Stockhoff 2022). Therefore, patients with very advanced stages of liver disease may not be suitable candidates for TIPS. However, most of these studies lack a control group. Thus, it remains unclear whether TIPS treatment impairs survival or whether the poorer outcome does rather reflect the prognosis of the more advanced liver cirrhosis (Bettinger 2021, Bureau 2011, Stockhoff 2021, Stockhoff 2022). In fact, some retrospective studies suggest that in patients with very advanced liver disease (e.g. as indicated by FIPS or CHE) survival is not impaired, but also no longer improved by TIPS insertion (Stockhoff 2021, Stockhoff 2022). Thus, TIPS could still be considered as a symptomatic treatment in these cases when liver transplantation is not available. Importantly, these studies also did not include patients with end-stage liver disease (e.g., bilirubin levels >100µmol/L). While TIPS may not necessarily worsen prognosis in advanced stages of cirrhosis, it certainly becomes less effective and is associated with more complications. Current guidelines recommend to use TIPS for ascites only as soon as patients enter the stage of recurrent or refractory ascites. However, the required frequency of paracentesis is linked to higher rate of ascites persistence after TIPS (Piecha 2024). Given the positive effects at earlier stages including the reduction of further decompensation, future studies need to determine whether it should be considered earlier in the natural history of cirrhosis.
Table 3. Absolute and relative contraindications for TIPS insertion| Relative TIPS contraindications |
| Cardiac ◦ Mild aortic valve stenosis ◦ E/A > 2 or E/A < 0.8 ◦ Two of the following: ▪ E/e´> 14 ▪ LAVI > 34 mL/m2 ▪ TR > 2.8 m/s ▪ sep e´ < 7 cm/s or lat e´< 10 cm/s |
| Liver function ◦ MELD ≥ 18 ◦ Bilirubin ≥ 50 µmol/L ◦ Platelets ≤ 75.000/µL |
| Primary or metastatic hepatic malignancy |
| Contrast agent allergy |
| Hyperthyreosis |
| Age ≥ 65 years old |
| Absolute TIPS contraindications |
| Cardiac ◦ LVEF ≤ 30% ◦ Moderate to severe aortic or pulmonary valve stenosis |
| Renal ◦ Chronic kidney failure > CKD4, except hepatorenal syndrome |
| Hepatic encephalopathy ◦ Acute ≥ 2. grade ◦ Recurrent/chronic encephalopathy ≥ 2. grade without specific trigger ▪ ≥ 2 episodes within 6 months |
| Liver function ◦ Bilirubin ≥ 80 µmol/L |
| Life expectancy ≤ 1 year |
| Unrelieved biliary obstruction |
| Active infection |
| Significant pulmonary hypertension (mPAP >35 mmHg) |
| Extensive primary or metastatic hepatic malignancy |
1. Billey C, Billet S, Robic MA, et al. A Prospective Study Identifying Predictive Factors of Cardiac Decompensation After Transjugular Intrahepatic Portosystemic Shunt: The Toulouse Algorithm. Hepatology. 2019;70(6):1928-1941. doi:10.1002/hep.30934
2. Schneider H, Berliner D, Stockhoff L, et al. Diastolic dysfunction is associated with cardiac decompensation after transjugular intrahepatic portosystemic shunt in patients with liver cirrhosis. United European Gastroenterol J. 2023;11(9):837-851. doi:10.1002/ueg2.12471
3. Stockhoff L, Schultalbers M, Tergast TL, et al. Safety and feasibility of transjugular intrahepatic portosystemic shunt in elderly patients with liver cirrhosis and refractory ascites. PLoS One. 2020;15(6):e0235199. Published 2020 Jun 25. doi:10.1371/journal.pone.0235199
4. Tripathi D, Stanley AJ, Hayes PC, et al. Transjugular intrahepatic portosystemic stent-shunt in the management of portal hypertension. Gut. 2020;69(7):1173-1192. doi:10.1136/gutjnl-2019-320221
5. European Association for the Study of the Liver. EASL Clinical Practice Guidelines for the management of patients with decompensated cirrhosis. J Hepatol. 2018;69(2):406-460. doi:10.1016/j.jhep.2018.03.024
Home-based ascites drainage systems
In patients who are not candidates for TIPS, continuous or daily ascites drainage may be considered as an alternative treatment to repeated LVP. In contrast to TIPS, CSPH and ascites formation are altered. However, ascites control can be achieved without the need for repeated medical interventions. There are mainly two different systems available. The first one is an implantable pump that drains fluid from the peritoneal cavity to the bladder (alfapump). The subcutaneous system can be charged and programmed with an external device. Early studies reported a higher incidence of renal failure and infections (Bellot 2013, Bureau 2017b, Solbach 2018, Stirnimann 2017). The frequency of these complications decreased with more experience and the use of prophylactic antibiotics. Continuous ascites drainage has been associated with less need for paracentesis and improved quality of life (Bellot 2013, Bureau 2017b, Solbach 2018, Stirnimann 2017, Wong 2020). However, the pump comes with significant cost and the need for surgery. Moreover, it is currently not available in Europe. The other option is a tunneled peritoneal catheter (PeCa). These are widely used for drainage of malignancy-associated fluid collections in the abdominal and pleural cavities (Lungren 2013, Maleux 2016). The system is less expensive, can be easily implanted with local anesthesia or light sedation, and can be removed in the same manner. It can therefore also be used as a bridging treatment (e.g. until transplantation or TIPS is available). Studies in patients with cirrhosis have shown a reduced need for paracentesis (Macken 2019, Solbach 2017) and an overall good control of ascites. Infections are frequent in the treated patients. However, randomised controlled trials are lacking and it remains uncertain whether PeCa implantation itself increases the risk for peritonitis. Of note, a retrospective study found no significant differences in the rate of infection between patients with PeCa and those treated with LVP. However, the detection rate of pathogens in the ascites was higher and more gram positive bacteria were found (Tergast 2022). Recently, a new PeCa version has been introduced that uses a silver coating. Preliminary data suggest that this significantly reduces the risk for peritonitis and the need for PeCa explantation (Schütte 2024) . Due to the continuous or intermittent daily drainage of ascites, both PeCa and the ascites pump are associated with hyponatraemia and renal impairment. In contrast to the more common hypervolemic hyponatraemia, these patients have a true sodium depletion due to the loss via ascites drainage. Sodium replacement may be required (Tergast 2023, Tergast 2022). Both hyponatraemia and renal impairment correlate with the amount of fluid that is removed per day. If possible, drainage volume should be limited to a maximum of 1.5 L/day (Tergast 2023).
Portal hypertensive bleeding
Clinical manifestation and relevance
Oesophageal and gastric varices are very common and are present in approximately 40% of patients with CHILD A and 70% of those with CHILD B/C cirrhosis (Kovalak 2007). However, varices due to portosystemic shunts may also be present at various sites in the gastrointestinal tract (Jansson-Knodell 2021, Kochar 2008, Norton 1998). Patients remain asymptomatic and eventually present with variceal hemorrhage, which is a traumatic and life-threatening event (Reverter 2014). After ascites and encephalopathy, it is one of the most frequent events of hepatic decompensation (Jepsen 2010, Mandorfer 2021). Improvement in endoscopic and medical management have reduced short-term mortality from 30-50% to 10-20% (Chalasani 2003, D'Amico 1997, Graham 1981, Reverter 2014, Stokkeland 2006). However, recurrent bleeding is associated with significant morbidity related to other cirrhosis-associated complications such as encephalopathy, hydropic decompensation and hospitalisation (Angeli 2018, Garcia-Tsao 2024, Montagnese 2022). Bleeding of gastric varices is less frequent than from oesophageal varices. However, when bleeding does occur, it is often more difficult to control and is associated with higher mortality (Sarin 1992). Besides varices, recurrent bleeding may also occur in portal hypertension, gastropathy and intestinopathy (Merli 2004, Urrunaga 2014).
Pathogenesis
The development of oesophageal and ectopic varices is the result of CSPH and the need for portosystemic collaterals. The risk of varices is closely related to HVPG levels. The risk of bleeding increases with values >15mmHg (Ripoll 2007).
Diagnostic work-up
Endoscopy is necessary to diagnose oesophageal and gastric varices. The risk of bleeding is closely related to the size of the varices, liver function and the presence of red colour signs (de Franchis 2022, Villa 2022). Thus, during endoscopy oesophageal varices should be classified as either small or large (>5 mm). In addition, they can be classified according to Paquet as grade I (varices extending just above the mucosal level), II (varices not completely compressed after air insufflation), or III (varices varices protruding more than one third of the luminal diameter and/or are in contact with each other) (Angeli 2018, Paquet 1982).
Gastroesophageal varices (GOV) and isolated gastric varices (IGV) are usually classified according to Sarin depending on their localisation as GOV1 and GOV2, as well as IGV 1 and IGV2 (Sarin 1992). These may differ in their bleeding risk and associated mortality rate (Angeli 2018).
Treatment
Acute variceal bleeding
Acute variceal bleeding demands urgent treatment. Initially, immediate resuscitation is required, including placement of large intravenous lines to prevent organ failure (Angeli 2018, Cárdenas 2001, de Franchis 2022). The most important factor in bleeding control in portal hypertensive hemorrhage is control of portal hypertension. In the emergency setting, the quickest way to lower portal pressure is to use vasoactive drugs that cause arterial splanchnic vasoconstriction and, thus decrease portal inflow. In general, terlipressin and somtatostatin (analogues) can be used (Angeli 2018, Avgerinos 1997, de Franchis 2022, Levacher 1995). Doing so before the endoscopy facilitates the subsequent sclerosing therapy or endoscopic variceal ligation (EVL). It is usually recommended that these medications be continued for five days, as this covers the time period of highest risk for rebleeding (Angeli 2018, de Franchis 2022, Dell'Era 2008). However, in low-risk patients, 24 hours may also be sufficient (Azam 2012). Blood (Angeli 2018, Mallet 2017) transfusion should usually not be given unless the hemoglobin level falls below 7 g/dL or the patient develops symptomatic anaemia (Villanueva 2013). Immediate antibiotic treatment (e.g., ceftriaxone) improves bleeding control and reduces the risk of rebleeding (Bernard 1995, Bernard 1999, Hou 2004). In addition, initiation of HE prophylaxis with lactulose is recommended (de Franchis 2022, Sharma 2011). Rifaximin is an alternative treatment option (Maharshi 2015). Routine use of procoagulant factors is usually not required. In fact, fresh frozen plasma can easily lead to volume overload, which further aggravate CSPH (Angeli 2018, de Franchis 2022). There is also no need to use proton pump inhibitors (PPI) in the absence of gastric ulcers. PPIs may be associated with smaller post-ligation ulcers. However, they do not alter the risk of rebleeding (Shaheen 2005). Their role in preventing ulcers in patients in the intensive care unit has also been questioned, recently (Krag 2018). Whether they are even harmful in cirrhotic patients still remains a matter of debate (Gairing 2024, Peña Rodríguez 2024, Tergast 2018). There are conflicting data regarding the use of tranexamic acid. In a large randomised trial in patients with upper GI bleeding, no effect on survival. However, patients treated with tranexamic acid experienced venous thromboembolic events at a higher frequency (Afolabi 2020). Importantly, nearly half of the patients had suspected variceal bleeding. In contrast, a smaller randomised trial in patients with cirrhosis found a greater chance to control variceal bleeding. However, survival remained unchanged (Kumar 2024).
After initial resuscitation, patients should undergo endoscopy to confirm the diagnosis, achieve bleeding control (if necessary) and prevent early rebleeding. However, the optimal timing of endoscopy remains to be determined. A recent study showed that for upper gastrointestinal bleeding, there was no benefit to performing endoscopy within 6h compared to 6-24h. However, less than 10% of the patients enrolled had variceal bleeding (Lau 2020). If bleeding control cannot be achieved and/or in case of early treatment failure (within) 24hour, the patient should be considered for treatment with rescue TIPS and/or coiling/sclerosis of the varices. If an interventional radiologist is not immediately available, balloon tamponade can be used as bridging therapy (Angeli 2018, de Franchis 2022). However, it comes with the need for endotracheal intubation and the risk of oesophageal necrosis or perforation. A better alternative in this case is the application of a self-expanding metal stent (SEMS). SEMS has been associated with a better bleeding control and survival when compared to balloon tamponade (Escorsell 2016). All patients, regardless from initial bleeding control, should be evaluated for preemptive TIPS (“early TIPS”). There are compelling data that patients with a CHILD B cirrhosis and active bleeding at index endoscopy or CHILD C cirrhosis (<14 points) benefit from TIPS insertion within 72h after variceal bleeding (García-Pagán 2010, Nicoară-Farcău 2021). This is also the case in patients with acute-on-chronic liver failure (ACLF). Elevated bilirubin levels and acute hepatic encephalopathy do not necessarily represent a contraindication for TIPS under these circumstances (Trebicka 2020a).
Primary prophylaxis
Either NSBB or EVL can be used for primary prophylaxis of variceal bleeding. The likelihood of bleeding is not different between the two options. However, NSBB do have other advantages as they also treat the underlying CSPH (Shah 2014, Villanueva 2019). NSBB may reduce intestinal permeability and systemic inflammation (Jachs 2021, Reiberger 2013a). The combination of EVL and NSBB was not superior to NSBB treatment alone in the majority of prospective studies (Lo 2010). However, a recent large prospective trial from India suggested a lower risk of bleeding in patients with decompensated liver cirrhosis and high-risk varices. NSBBs cause arterial splanchnic vasoconstriction via b2 blockade and cardiodepression via b1 blockade (Tevethia 2024). Both act synergistically to reduce portal pressure. Carvedilol, which also has an additional a1 blockade, has been shown to be more effective than propranolol (Kim 2016, Reiberger 2013b). It is also easier to titrate it to an effective dose (Turco 2023). Primary prophylaxis of variceal bleeding is indicated in patients with either large varices or small varices and red spots or CHILD C cirrhosis (de Franchis 2022). If primary prophylaxis with NSBB is established and well tolerated, follow-up endoscopy is not required at least among those with compensated cirrhosis. Of note, in patients with only small varices and CHILD A/B cirrhosis, NSBB does neither prevent bleeding nor the development of large varices (Groszmann 2005). However, the prospective PREDESCI study and a recent meta-analysis data demonstrated that NSBB may still prevent hepatic decompensation (i.e., ascites) in patients with CSPH (Villanueva 2019, Villanueva 2022). While this was especially true for those with small varices, some recently proposed algorithms support the use of NSBB when CSPH is diagnosed with non-invasive tools (i.e., LSM). This may eliminate the need for endoscopy (Garcia-Tsao 2021). There has been an intense debate about the safety of NSBB in advanced stages of cirrhosis (Sersté 2010), suggesting the existence of a therapeutic window (Ge 2014). In those with cirrhosis-associated circulatory dysfunction, additional cardiodepression and a1 blockade certainly have detrimental effects with an increased risk of acute kidney injury (Téllez 2020, Tergast 2019). However, the question remains as how to define the window. Some have suggested the presence of refractory ascites or SBP, but this has not been confirmed by others (Leithead 2015, Mandorfer 2014, Sersté 2010, Tergast 2019). Even in the case of ACLF, NSBBs have shown beneficial effects (Mookerjee 2016, Tergast 2019). However, systemic arterial pressure seems to be good indicator. In patients with a systolic pressure below 90 mmHg or a MAP of <65 mmHg patients have an increased risk of AKI but not beneficial effect on ACLF or survival (Tergast 2019).
Secondary prophylaxis
In contrast to the setting of primary prophylaxis, the combination of NSBB and EVL is widely accepted to be superior to either NSBB or EVL alone (Puente 2014). This affects both mortality and the risk of rebleeding. Patients should also be evaluated for TIPS insertion, which should be performed if secondary prophylaxis fails or if adequate secondary prophylaxis is not possible for any reason. If TIPS is chosen as a treatment option, it should be used as soon as possible after the bleeding event. It has been shown to be highly effective in preventing rebleeding and it improves survival (de Franchis 2022, Sauerbruch 2015). If TIPS is not an option, patients may be considered for retrograde balloon-assisted obliteration of portosystemic shunts (e.g., BRTO) (Table 4).
Table 4.| Primary prophylaxis | Acute portal hypertensive bleeding | Secondary prophylaxis | Recurrent bleeding |
Indication
|
Initial treatment
|
Early/preemptive TIPS
|
TIPS |
Hepatic encephalopathy
Clinical manifestation and relevance
Hepatic encephalopathy (HE) describes a clinical syndrome characterised by a broad spectrum of neuropsychiatric abnormalities in patients with liver disease. Patients may present with overt HE defined by obvious, clinically apparent changes that can range from impaired orientation to coma. In contrast, those with covert HE can usually be only be diagnosed by a careful history or, in the case of minimal HE (mHE), only by a specific neuropsychometric assessment (Montagnese 2022, Vilstrup 2014). HE is highly prevalent among patients with cirrhosis. The annual incidence of overt HE cirrhotic patients has been estimated to be around 2-10% (Benvegnù 2004, Tapper 2019) with a considerable range depending on the severity of liver disease and the underlying aetiology (Rose 2020, Vilstrup 2014). In patients with decompensated liver cirrhosis overt HE is prevalent in 10-14% at the time of diagnosis (Jepsen 2010, Saunders 1981). Minimal HE may be diagnosed in approximately 40% of patients with cirrhosis (Ehrenbauer 2024, Gairing 2023). HE is associated with impaired quality of life, significantly increased morbidity and health-care related costs (Hirode 2019, Lv 2024, Shaheen 2019). The recurrence rate is high despite the use of prophylactic measures (Kang 2017, Sharma 2009). Even mHE can be linked to signficant impairments of activities in daily living including driving skills (Redfield 2024). Moreover, mHE is a risk factor for the subsequent development of overt HE (Redfield 2024). After the first episode of overt HE, mortality increases up to 85% within five years (Jepsen 2010).
Pathogenesis
The pathogenesis of HE is complex and, so far, still incompletely understood. Several factors may contribute to the development of HE. However, there are two components that widely are considered to be central to the pathophysiology: impaired hepatic detoxification and portosystemic shunts (Praktiknjo 2020a, Rose 2020). According to the EASL guidelines, HE can be classified as type A, B or C depending on the pathogenesis. Type A is present in acute liver failure where impaired detoxification plays a major role. Type B occurs in those with large portosystemic shunts, which impair outcome, especially if their cumulative area exceeds 83 mm2 (corresponding to a single shunt with a diameter of 10 mm) (Praktiknjo 2020b). Type C HE is present in cirrhosis (mixture of SPSS and impaired liver function) (Montagnese 2022). Regardless of the predominant cause of HE ammonia is one of the central molecules involved in the pathogenesis. The main source of ammonia is the gut where it is a product of protein digestion and bacteria urease activity. However, it is also produced and required in certain amino acid metabolisms in several organs including the liver itself. Excess ammonium is usually eliminated in the liver via the urea cycle. In case of excess production or impaired elimination i.e. due to hepatic impairment or portosystemic shunts, ammonium molecules may enter the brain and subsequently the astrocytes, where it is metabolised to glutamine. The resulting increase in intracellular osmotic pressure forces fluid into the astrocytes, causing swelling and dysfunction. This can be exacerbated by hypoosmotic serum, for example as a result of hypoproteinaemia and hyponatraemia (Rose 2020, Gallego-Durán 2024). Ammonia detoxification via the glutamine dehydrogenase may also be accompanied by increased neuronal levels of the inhibitory neurotransmitter γ-aminobutyricacid (GABA) (Sørensen 2024). Furthermore, ammonia has been linked to oxidative stress resulting from neutrophil dysfunction, which increases neuronal vulnerability and neuroinflammation. Increased systemic inflammation also contributes to neuroinflamamtion (Rose 2020, Gallego-Duran 2024) (Figure 4).
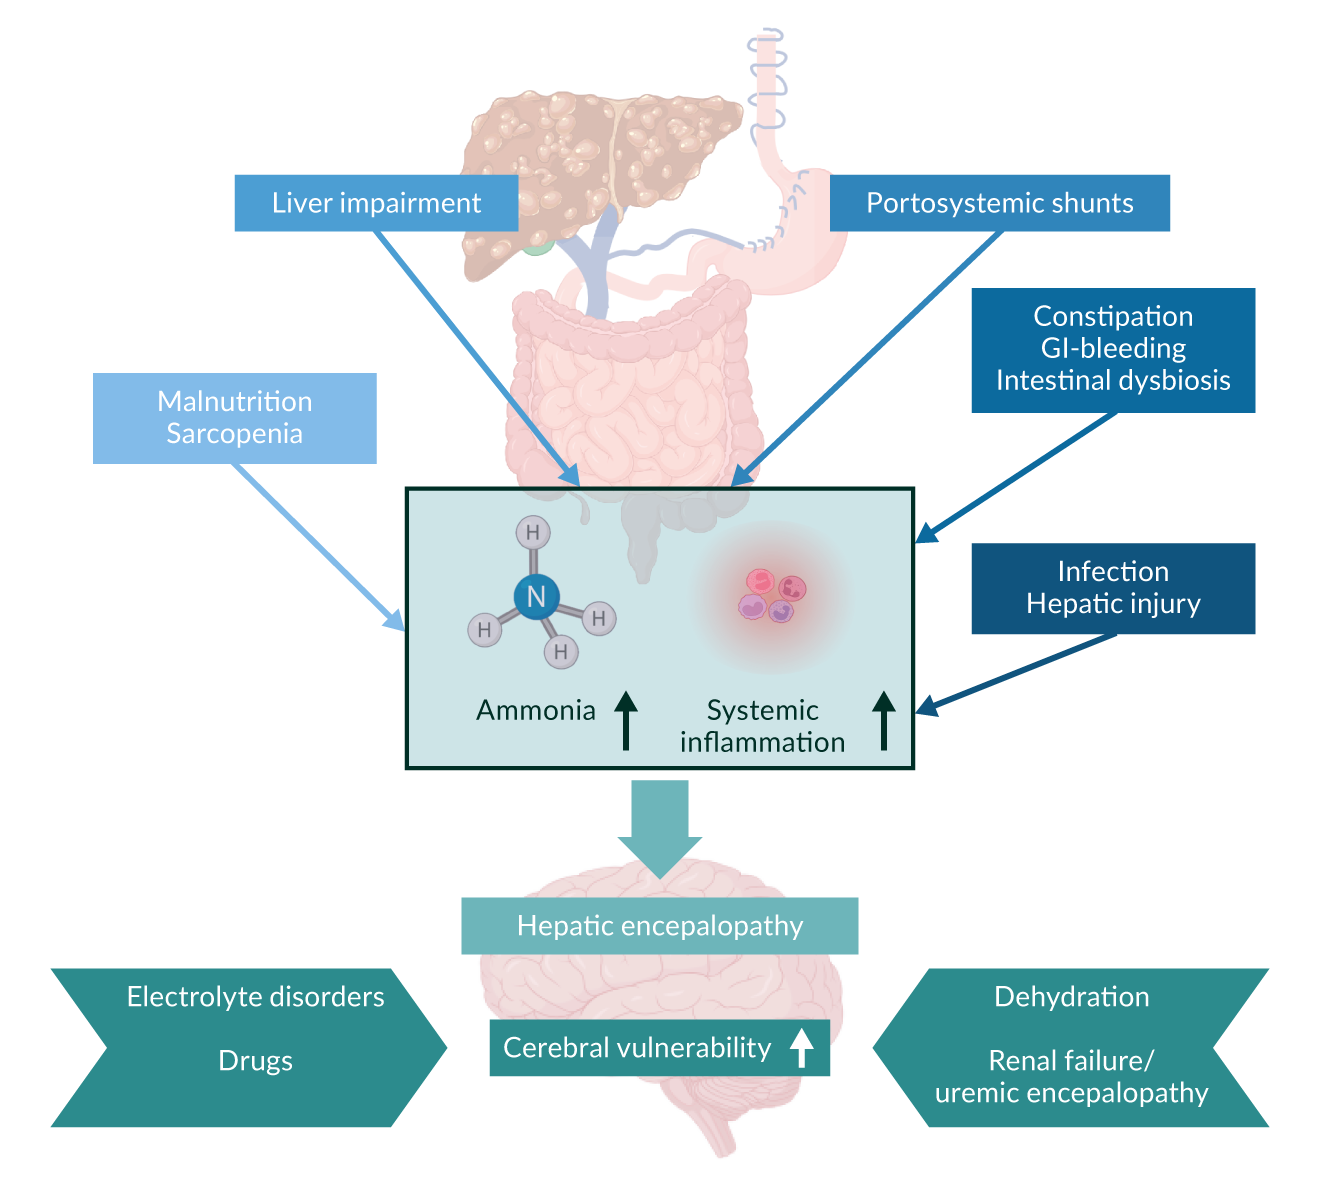 Figure 4.
Diagnostic work-up
The diagnosis of HE requires the exclusion of all relevant differential diagnoses. Contributing factors such as hyponatraemia and gastrointestinal bleeding must also be identified. The diagnostic relevance of ammonia has been debated over decades. However, its measurement can help to attribute neurocognitive impairment to cirrhosis or rule in differential diagnoses (Montagnese 2022). Moreover, elevated serum ammonia levels indicate a higher risk of overt HE development (Ballester 2023). Given the high inter-laboratory variability, recent studies have suggested using the ratio of ammonia to the local upper limit of normal rather than absolute ammonia levels (Ballester 2023, Tranah 2022).
However, at this stage, overt HE remains a diagnosis to be made clinically. It should be graded according to the West Haven criteria. This can be challenging and time consuming in routine clinical practice. The joint EASL/AASLD guidelines suggest a more practical approach based on the patient's level of orientation. Those with impaired orientation regarding the time are considered to have HE grade II, while an insufficient orientation with regard to space can be classified as HE grade III. HE grade IV is characterised by hepatic coma in which the patient is unresponsive to painful stimuli (Vilstrup 2014). To diagnose HE grade I, clinicians need to be familiar with the patient's usual cognitive level (e.g. with the help of a relative), as neurocognitive impairment is by definition not obvious (Table 5) (Vilstrup 2014).
Table 5.Suggested application of West Haven Criteria for Hepatic Encephalopathy in clinical practice.| West Haven Criteria | Description | Suggested criteria for clinical practice |
| Unimpaired | No history of HE and no current encephalopathy | Tested and proved to be normal |
| Minimal |
|
|
| Grade I |
|
Patient presents with cognitive or behavioral decline with respect to his or her standard on clinical examination but is oriented in time and space |
| Grade II |
|
Disoriented for time whilst the other symptoms mentioned might also occur |
| Grade III |
|
Disoriented for space whilst the other symptoms mentioned might also occur |
| Grade IV |
|
No response even to painful stimuli |
Specific neuropsychometric tests must be used to assess mHE. The gold standard is the Psychometric Hepatic Encephalopathy Score (PHES), which can be obtained using the Portosystemic Encephalopathy Syndrome Test (PSE), which consists of a comprehensive test battery of 5 subtests (Weissenborn 2001). The PSE may provide the most comprehensive and accurate assessment of neurocognitive status. However, it is also quite time-consuming. A number of alternative tests have been proposed in the past, varying in their diagnostic accuracy for mHE and their predictive value for oHE (Table 6) (Ehrenbauer 2024). Among these, the Animal Naming Test (ANT) has been shown to be of significant value when used as a screening tool in clinical practice. Patients are asked to name as many animals as possible in one minute. Adjustments, e.g. for the educational level, need to be considered when using this test and different norms have been suggested for different regions (Campagna 2017, Ehrenbauer 2024, Labenz 2019). Another app-based alternative is the stroop test, which showed a high correlation with PHES and can be done by patients without supervision by dedicated staff and is also available in an abbreviated version (Acharya 2023, Ehrenbauer 2024, Labenz 2024).
Table 6. Selected tests for mHE assessment| Test | Test description | Time and equipment required | Cut-off values |
| PSE Syndrome Test | The PSE-Syndrome Test, yielding the Psychometric hepatic encephalopathy score (PHES) is a neuropsychological paper-pencil based test which is the surrogate goldstandard for diagnosing mHE. The test is evaluating psychomotor speed and visuomotor and -spatial orientation in 5 subtests. It is validated in numerous languages/countries. | 15–20 minutes Timer, pencil, test sheets | Score < -4 to -3 depending on regional norm values |
| Animal Naming Test (ANT) | The ANT is a word-fluency test in which patients had to name in one minute as many animals as possible. Recent studies recommend ANT for selecting patients for further HE diagnostics. It is the only bedside test. | 2–3 minutes with explanation Timer | Age and education norms avilable only for Italy <23 animals (Germany) <14 animals (India) <20 animals (China) |
| EncephalApp (Stroop) | The EncephalApp is a smartphone-based version of the classic paper-based Stroop test that assesses psychomotor speed and cognitive flexibility. Here, patients had to react on a coloured font of a word that names a different color. | 5–15 minutes Smartphone and EncephalApp | Age and education norms avilable only for USA >185.1s (Germany) |
| Critical Flicker Frequency (CFF) | A psychophysiological test in which patients have to react to a rapidly flickering light when it seems flickering to them. Problems can arise due to high variability of the test runs. There are competing study results with regard to the predictive value. | 5–15 minutes HEPAtonorm analyzer | <39 Hz Age and education norms avilable only for Germany |
| Inhibitory Control Test (ICT) | The ICT is a computer-based test which evaluates working memory and sustained attention. Difficulties with the test are complex test clarification and long duration. | 20 minutes Computer and ICT software (via www.hecme.tv, curently offline) | >24 Weighted Lures Age and education norms avilable only for Germany and USA |
| Continuous Reaction Time Test (CRT) | CRT measures the time between an auditory stimulus and a motor response. The score, the CRT index, looks at the variability of reaction times. Here, a high variability should indicate a cognitive deficit. One advantage of this test is its independence of age and education. | 15 minutes Computer and EKHO CRT equipment | CRT-Index <1.9 |
Treatment
If the trigger of HE can be identified, it should be treated first. This includes correcting electrolyte ibalances and stopping certain medications (Montagnese 2022, Vilstrup 2014). Most of the available specific medical treatments for HE target ammonia (Rose 2020).
Lactulose
Lactulose is a non-resorbable disaccharide that has long been used as a symptomatic treatment for constipation. Its mode of action consists of acceleration of intestinal transit time as an osmotic laxative and of the decrease of the intestinal pH. The latter results in a higher proportion of NH4+ compared to NH3, which leads to a lower ammonium resorption. It also leads to favourable changes in the gut microbiota (Elkington 1969). Lactulose has proven efficacy in the treatment of acute HE as well as in secondary prophylaxis (Als-Nielsen 2004, Gluud 2016). Intra-rectal administration can be used in the treatment of acute HE. Oral dosing is usually titrated up to a target of 2-3 soft bowel movements per day. However, tolerance is limited, especially for long-term treatment, as it is often associated with abdominal discomfort. A small but randomised trial documented that a single dose of polyethylene glycol led to an even faster resolution of HE than standard treatment with lactulose (Rahimi 2014).
Rifaximin
Rifaximin is an antibiotic that is only minimally absorbed in the gut. It is thought to work by decontaminating the gut, which is associated with reduced ammonia production by gut bacteria. In severe cases, rifaximin might help speed recovery from HE and might even reduce mortality when added to lactulose (Sharma 2013). More importantly, rifaximin has been shown to be effective for secondary prophylaxis in combination with lactulose (Bass 2010, Kang 2017).
L-ornithine-L-aspartate (LOLA)
LOLA contains two amino acids that are required for urea synthesis and glutamine synthesis, both of which are natural pathways for ammonia elimination. It has therefore been suggested that LOLA supports ammonia detoxification. There has been a long ongoing debate about the efficacy of LOLA in HE therapy, particularly when used as an oral preparation (Vilstrup 2014). A well-conducted meta-analysis including 36 trials and 2377 patients found a significant positive impact of LOLA on mortality and HE resolution when compared with placebo or no intervention. However, the authors noted that the quality of the individual studies included was limited (Goh 2018). Recently, a well-performed prospective double-blind, randomised controlled trial demonstrated the efficacy of intravenous LOLA in severe HE (grade III+IV) when added to rifaximin + lactulose. Treated patients benefited from faster HE recovery and lower mortality (Jain 2022).
Branched-chain amino acids (BCAA)
BCAA facilitate albumin and muscle protein biosynthesis, which may help to reduce ammonia production (Kawaguchi 2013). Meta-analyses support the beneficial effect of BCAA on HE recovery, while mortality remains unchanged (Gluud 2017).
Embolisation of portosystemic shunts
If medical treatment fails, embolisation of SPPS is an effective treatment that should be considered (Montagnese 2022). The procedure is generally safe (Ke 2022, Laleman 2013, Privitera 2018). However, it also worsens portal hypertension and may subsequent complication such as ascites.
Dialysis
In cases of severe HE, hemodialysis can remove ammonia very quickly. This also leads to electrolytes rebalance and removal of urea, which may contribute to encephalopathy in patients with renal impairment. Systems that use albumin and its binding capacity may be even more effective (Hassanein 2007).
Fecal microbiota transplant (FMT)
FMT may be a future treatment option for patients with recurrent HE. Some promising pivotal studies have been published, showing improvements in PHES and other psychometric tests (Bajaj 2017, Bajaj 2019). However, more studies are needed before this can be recommended for routine clinical practice.
Acute kidney injury in cirrhosis
Clinical manifestation and relevance
Kidney disfunction is very common in advanced stages of liver cirrhosis affecting 27-53% of hospitalised patients (Pose 2024). Kidney dysfunction is a continuum in cirrhosis and increasing creatinine levels correlate with the risk of short-term mortality. Thus, serum creatinine is part of several prognostic scores in cirrhosis including the MELD score and its squeals, which determine donor liver allocation in several eras of the world (Martin 2024). However, due to the low muscle mass in patients with liver cirrhosis, kidney dysfunction may also be present at lower creatinine levels (Angeli 2018). Therefore, a rapid rise in serum creatinine or a significant decrease in urine output should prompt immediate diagnostic and therapeutic intervention, even before a specific threshold is reached. Acute Kidney Injury (AKI) is defined as an increase in serum creatinine by more than 50% from the baseline within one week or an increase of ≥ 26.4 μmol/L (≥ 0.3 mg/dL) within 24 (48) hours (Nadim 2024). While the majority of AKI episodes are mild (AKI 1), even the distinction between AKI1a (serum creatinine <1.5mg/dL) and AKI1b (serum creatinine ≥1.5 mg/dL) has important prognostic implications (Huelin 2017) . Renal failure in patients with acute decompensation of liver cirrhosis is indicated by serum creatinine levels above 2 mg/dL and should not be confused with HRS, as HRS indicates a very poor prognosis (Nadim 2024). Renal failure is also the most common manifestation (> 50%) of Acute-on-Chronic Liver Failure (ACLF), a specific form of acute decompensation associated with very high short-term mortality (Moreau 2013). Patients may also present with a slow rise in serum creatinine referred to as Non-AKI (NAKI). Chronic kidney disease is defined by a glomerular filtration rate (GFR) of < 60 mL/min, calculated using the Modification of Diet in Renal Disease 6 (MDRD6) formula, persisting for at least three months (Nadim 2024) (Table 7).
Table 7. Diagnostic criteria for kidney dysfunction in advanced liver cirrhosis| Subject | Definition | |||
| Definition of Baseline sCr |
|
|||
| Definition of AKI |
|
|||
| Staging of AKI |
|
|||
| Progression of AKI | Progression | Regression | ||
| Progression of AKI to a higher stage and/ or need for RRT | Regression of AKI to a lower stage | |||
| Response to treatment | No response | Partial response | Full response | |
| No regression of AKI | Regression of AKI with a reduction of sCr to ≥0.3 mg/dL (≥26.5 µmol/L) above the baseline value | Return of sCr to a value within ≥0.3 mg/dL (≥26.5 µmol/L) of the baseline value | ||
| Diagnostic Criteria for HRS |
or GFR <60 mL/min/1.73 m2 or markers of kidney damage ≤90d HRS-CKD: HRS + GFR <60 ml/min/1.73 m2 and/or markers of kidney damage for >90d |
|||
Citations EASL Guideline cirrhosis AND Position Paper
Pathogenesis
There are various types of AKI and triggers of kidney damage. However, patients with cirrhosis are particularly susceptible for AKI, which is a result of the systemic inflammation and hemodynamic alterations that can be observed among patients with CSPH and advanced liver cirrhosis and may even be further enhanced by comorbidities or treatment related effects e.g. LVP or diuretic treatment. The decrease in systemic arterial blood pressure leads to activation of RAAS and the sympathetic nervous system and vasoconstriction of the renal artery and afferent glomerular arterioles (Adebayo 2023, Pose 2024). This results in renal hypoperfusion. In the recent years, it became evident that systemic inflammation and in particular the inflammatory driving factors, namely PAMPs and DAMPs, have direct deteriorating effects on renal function. PAMPs and DAMPs may enter the renal blood flow and cause renal inflammation (Pose 2024, Solé 2019). Besides direct cellular damage this leads to further decrease of renal blood flow. Ultimately, the changes linked to CSPH, systemic inflammation and circulatory dysfunction will lead to renal damage that is called hepatorenal syndrome (HRS-AKI).
Diagnostic work-up
In all patients with cirrhosis and AKI the potential trigger should be identified and removed as soon as possible. Those progressing to stage 1b or higher should be assesssed for the presence of HRS. HRS represents the maximal renal dysfunction in liver cirrhosis and is potentially reversible. Generally, two forms are still distinguished: HRS type I (HRS-AKI) is characterised by rapid renal failure, defined as a doubling of serum creatinine over 2.5 mg/dL (226 mmol/L) within less than two weeks. HRS type II (HRS-NAKI) is often associated with refractory ascites and shows moderate renal failure with serum creatinine levels between 1.5 and 2.5 mg/dL (133 to 226 mmol/L) with a stable or slowly progressive course. However, HRS is cannot be diagnosed immediately, serum creatinine must be > 1.5 mg/dL (> 133 mmol/L) and there must be no improvement after at least one day of withdrawal of all diuretics and adequate volume resuscitation (Nadim 2024). In the past, HRS was strictly diagnosed by exclusion, not associated with shock, nephrotoxic medications, parenchymal kidney disease (proteinuria > 500 mg/d, abnormal urine sediment, microhematuria, pathological kidney ultrasound). It is now accepted that HRS-AKI can also occur in the presence of other (chronic) kidney disease. Therefore, the absence of strong evidence for an alternative explanation as the primary cause of AKI is sufficient to establish the HRS-AKI diagnosis (Nadim 2024) (Figure 5).
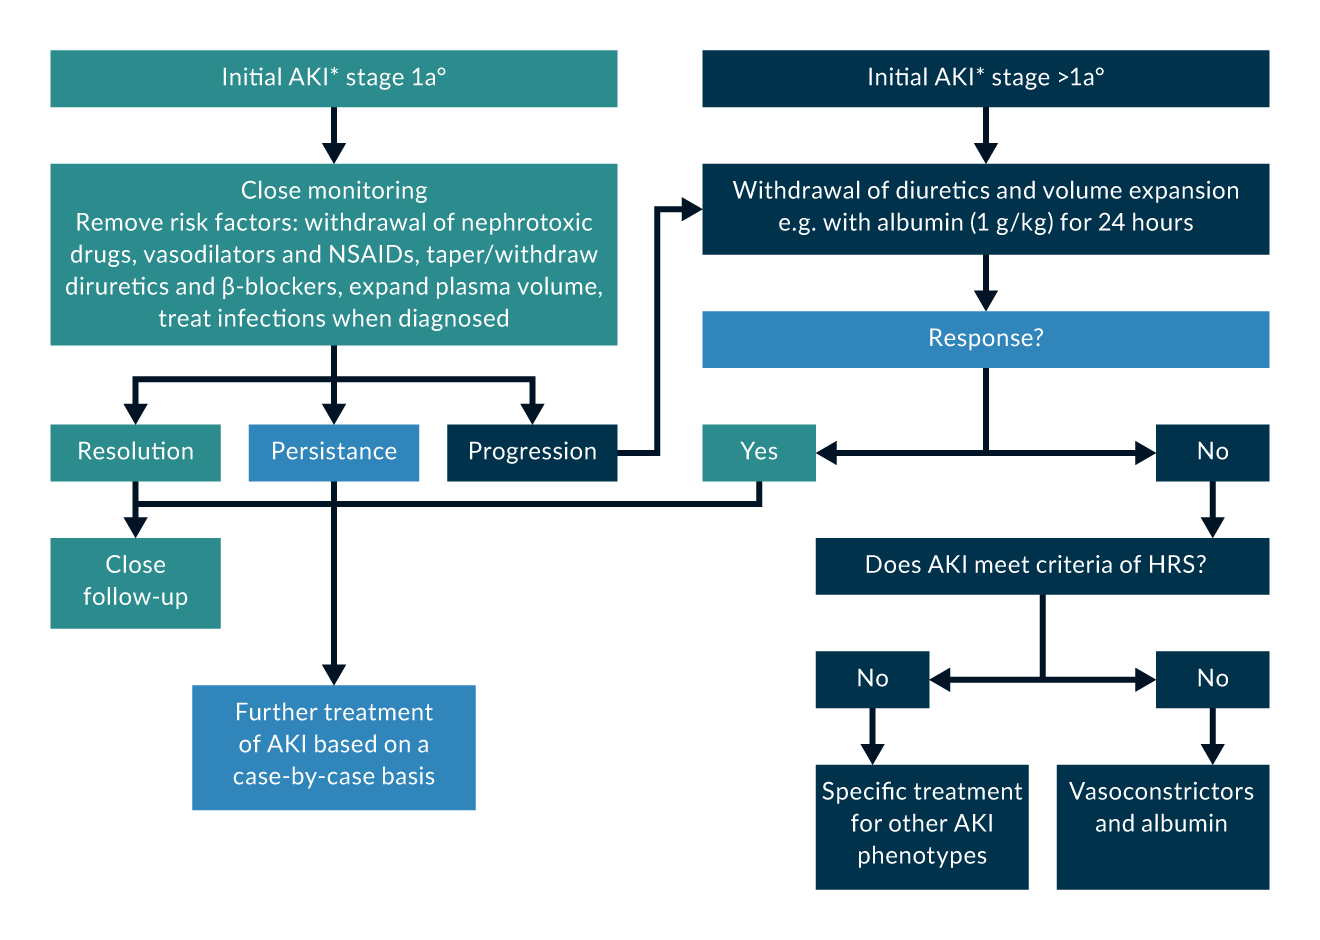 Figure 5. *AKI at the first fullfillment of KDIGO criteria.
Treatment
Any AKI should be treated by removing the precipitating factor and all nephrotoxic medications. The specific treatment of HRS type I (HRS-AKI) includes intravenous albumin administration of 20-40 g/day and additional therapy with vasoconstrictors. If there are no contraindications, terlipressin is the drug of choice, as it significantly improves short-term survival in combination with albumin infusions. This therapy should start with a terlipressin dose of 2–4 mg/day and be continued for at least three days. Terlipressin should be used at a maximum dose of 12 mg/day (Angeli 2018, Nadim 2024). Instead of repeated bolus application, terlipressin can also be given as a continuous infusion in HRS (initial dose 3 mg over 24 hours), which may reduce the required dose and side effects (Cavallin 2016). In patients under intensive care supervision, continuous norepinephrine administration may also be effective, although not in combination with terlipressin (Singh 2012, Wong 2021). Other vasoconstrictors are not recommended due to insufficient data.
While the administration of terlipressin in patients with HRS type I (HRS-AKI) is recommended in most guidelines worldwide, including Europe, the use of terlipressin as a vasoconstrictor for the treatment of HRS has not yet been approved in the United States. A recently published phase 3 study (CONFIRM) was designed to confirm the efficacy and safety of terlipressin in combination with albumin in patients with HRS Type I. The study was randomised 1:2 with a placebo control for 14 days. The primary endpoint was the reversal of HRS, defined as two consecutive measurements of creatinine below 1.5 mg/dL, taken more than 2 hours apart, with survival without dialysis for at least 10 days after the completion of treatment. A total of 300 patients were randomised, 199 to terlipressin and 101 to placebo. Terlipressin led to a reversal of HRS in 32% of patients, while the primary endpoint was achieved in only 17% of patients in the placebo group. Liver transplantation was performed in 46 patients (23%) in the terlipressin group and 29 patients (29%) in the placebo group, with 50% vs. 45% mortality. Respiratory deterioration within 90 days accounted for 11% of deaths in the terlipressin group and 2% of deaths in the placebo group. The cardiodepressive effect of terlipressin is an additional side effect that may have influenced the results of the CONFIRM study (Wong 2021).This was particularly present among those with ACLF grade 3. Moreover, terlipressin was not linked to a higher rate of reversal of renal failure in this group but even a numerically higher mortality. Therefore, the use in ACLF grade 3 may not be recommended (Wong 2022).
In a recently published Danish study, 25 patients with ascites and impaired kidney function were randomised 2:2:1, group A received terlipressin combined with dobutamine, group B received dobutamine and terlipressin as sequential monotherapies, and group C received placebo. Dobutamine monotherapy increased cardiac output without affecting GFR. Terlipressin alone improved GFR and mean arterial pressure but decreased cardiac output. The combination of dobutamine and terlipressin had a favourable effect on cardiac output, but no additional effect on mean arterial pressure or GFR . This study showed that dobutamine alone does not have a favourable effect on systemic or renal hemodynamics in patients with ascites. However, it suggests that the combination with dobutamine may be an option for patients with terlipressin and cardiodepressive side effects (Israelsen 2020).
Patients with HRS type II (NAKI-HRS) are unlikely to benefit from this therapy and are treated similarly to patients with refractory ascites. Especially in these patients, but generally in all patients with HRS, a TIPS could be considered. Renal replacement therapy is indicated only in the presence of dialysis criteria, mainly as a bridge to liver transplantation, the only potentially curative treatment for HRS. For intended liver transplantation, albumin and terlipressin should be administered, as patients with renal insufficiency have a significantly poorer postoperative prognosis. In patients with HRS and prolonged dialysis dependency, the indication for sequential liver/kidney transplantation should be considered (Angeli 2018, Nadim 2024).
Infections and cirrhosis-associated immune dysfunction (CAID)
Clinical manifestation and relevance
Advanced liver cirrhosis is accompanied by a complex and, so far, not completely understood cirrhosis-associated immune dysfunction (CAID) (Albillos 2014, Albillos 2022). As a result, the incidence of infection is 4-6 times higher than in non-cirrhotic individuals (Fernández 2002, Fernández 2021). In the event of infection, mortality is 4x increased (Arvaniti 2010, Jalan 2014a) and the prognosis remains impaired even after the infections resolved (Kimmann 2019). Many cirrhotic patients develop multiple infections during hospitalisation and mortality almost doubles with each infectious episode (Bajaj 2012, Schultalbers 2020). Bacterial infections are a major cause of hepatic decompensation (e.g. variceal bleeding and worsening of ascites) (Fernández 2019, Moreau 2023) and the most common trigger of (ACLF) (Arroyo 2015, Moreau 2013). The most frequent sites of infection are spontaneous bacterial peritonitis (SBP) and urinary tract infections (UTI) (Schultalbers 2020). A particular threat is the emergence of multi-drug resistant bacteria (MDRB) (Fernández 2019, Hillert 2021, Piano 2019). These are highly prevalent in nosocomial infections and are associated with the development of sepsis and a poor survival (Fernández 2019, Piano 2019). The detrimental effects of infections are not limited to bacterial pathogens. More serious causes have also been documented for viral infections such as COVID-19 or influenza (Qiu 2020, Schütte 2019, Singh 2020). A particular poor prognosis has been described for invasive Candida infections (Barros 2023).
Pathogenesis
The liver and its resident immune cells play a central role in the immune system. They mediate immune tolerance, recognises systemic and gut-derived pathogens and orchestrate appropriate responses such as the production of pro-inflammatory cytokines and acute phase proteins. In patients with cirrhosis, liver dysfunction, reduced intestinal barrier function and increased systemic inflammation are the key drivers in the pathogenesis of CAID (Albillos 2022, Hasa 2022). Portal hypertension and intestinal dysbiosis facilitate translocation of gut bacteria and bacterial products into the portal vein. The resulting hepatic and systemic inflammation as indicated by increased levels of several pro-inflammatory cytokines such as TNF, IL-6 and IL-8. This is associated with the transition from the compensated to the decompensated stage of cirrhosis and with the degree hepatic impairment (Albillos 2022, Hasa 2022). Ultimately the persistent inflammation leads to a compensatory but excessive immunosuppressive response (e.g. mediated by IL-10) that turns into a state of immune paralysis and immune cell exhaustion, making patients particularly vulnerable for infections (Albillos 2022, Hasa 2022). However, the mechanisms of CAID are much more complex as there are several other important contributing factors. The distortion of liver histology, the lower amount of total liver tissue as well as the increasing number of porto-systemic shunts interfere with the liver`s role as an immune filter and initial place of antigen recognition (Albillos 2022, Hasa 2022). Impaired hepatic function lowers the capability of the synthesis of acute phase and complement proteins (Homann 1997). Functional changes can also be documented at the cellular level, affecting various innate and adaptive immune cells, including monocytes, neutrophils and lymphocytes. Overall, the number of circulating monocytes is increased but functionally impaired, with reduced phagocytic capacity and lysosomal enzyme production (Albillos 2022, Nakagawara 1984). Neutrophils are characterised by a higher degree of respiratory burst but lower phagocytic capacity and reduced circulating levels (Albillos 2022, Shawcross 2008). Circulating CD4+ T helper cells are also reduced, while certain subsets of CD8+ T cells are increased (Albillos 2022). T-helper cell impairment leads to reduced B-cell function and lower immunoglobulin levels in advanced stages of cirrhosis (Basho 2021). Importantly, these decreased IgG levels are associated with a higher risk of ACLF and death in patients with decompensated liver cirrhosis (Tergast 2021).
Diagnostic work-up
Early diagnosis and prompt initiation of an adequate treatment is crucial to limit morbidity and maximise patients’ chances of survival (Jalan 2014a). In the case of SBP, every hour of delay is associated with a 3% increase in mortality (Kim 2014). However, the clinical diagnosis of an infection in a cirrhotic patient can be challenging. Symptoms of hepatic decompensation, such as hepatic encephalopathy or worsening of ascites, may dominate the clinical picture. Thus, any new onset of hepatic decompensation or worsening of cirrhosis-related complications should be considered as an alarm signal and the patient should be evaluated for the presence of an infection, including a diagnostic paracentesis (Angeli 2018, Jalan 2014a). There has been a long debate about the utility of biomarkers. Pancytopenia is highly prevalent in patients with liver cirrhosis, limiting the value of leucocytosis. C-reactive protein (CRP) can indicate the presence of infection. However, as it is produced in the liver, false negatives must be considered (Park 2005). In contrast, systemic inflammation leads to chronic elevations of CRP even in the absence of infection (Jalan 2014a). Unlike CRP, procalcitonin (PCT) levels are less dependent on liver function. While PCT correlates with infection in cirrhosis, e.g. SBP (Yang 2015), as well as with the outcome of infections (Girardi 2024), it can also be elevated due to systemic or hepatic inflammation (Sato 2020, Simbrunner 2023). Some other biomarkers such as presepsin and resistin have been suggested, but their role still remains to be determined (Fischer 2019). Overall, biomarkers are not able to replace careful clinical evaluation at this stage. If an infection is suspected, the diagnostic work-up should include a diagnostic paracentesis and culture of ascites fluid (if ascites is present), urine sediment examination and a chest x-ray (Fernández 2021).
Treatment
Spontaneous bacterial peritonitis (SBP)
SBP is diagnosed when the ascitic polymorphonuclear count exceeds 250/µl (Angeli 2018). Antibiotic treatment should be started immediately, but must be chosen carefully. An inappropriate choice of the antibiotic leads to a more than twofold increase in mortality (Fernández 2019). A small prospective randomised trial demonstrated a superior survival when patients were treated aggressively with daptomyicin and meropenem instead of ceftazidime (Piano 2016). However, the widespread use of broad-spectrum antibiotics is certainly followed by a further emergence of MRBD (Piano 2019). Therefore, an individualised, risk-based approach seems necessary. As nosocomial infection has been confirmed as the most relevant risk factor for MRBD across different studies (Fernández 2012, Fernández 2019, Fernández 2021, Piano 2019), current EASL guidelines recommend a stratification into community-acquired, healthcare associated and nosocomial SBP (Angeli 2018). In addition, the severity of infection (e.g. sepsis and/or ACLF) should be taken into account. Third-generation cephalosporins appear to be sufficient for community-acquired SBP. However, if the infection is nosocomial and/or associated with organ failure, more aggressive treatment, e.g. a carbapenem +/- a glycopeptide antibiotic, should be used (Angeli 2018). Carbapenems have shown to be highly effective, including excellent and rapid distribution into the ascites fluid (Griemsmann 2022, Piano 2016). Glycopeptides should be considered particularly if there is an increased risk of infections with gram positive species (e.g. with enterococci) (Angeli 2018). This is the case, for example, among patients treated with high doses of PPIs (Tergast 2018, Wellhöner 2019), those with PeCa (Tergast 2022) and recent endoscopic procedures (Reuken 2012), and in alcoholic liver disease, where Enterococcus faecalis is closely linked to disease progression (Duan 2019, Llorente 2017). The efficacy of antibiotics should be monitored by a diagnostic paracentesis 48 hours after treatment initiation, which should show a reduction in PMN count of at least 25% (Angeli 2018). Patients with SBP benefit from albumin treatment, which can counteract circulatory dysfunction in these patients (Mandorfer 2014, Salerno, Navickis, Wilkes 2013, Sort 1999). 1.5 g/kg body weight on day 1 followed by 1g/kg body weight on day 3 is usually recommended based on the original study protocol by Sort et al (Angeli 2018, Sort 1999). Once the SBP has resolved antibiotic prophylaxis should be initiated for as long as the ascites persists (Angeli 2018, Ginés 1990, Titó 1988). Some patients may even benefit from primary SBP prophylaxis (Fernández 2007) . A potential risk factor for SBP is a low ascites protein level (Guarner 1999, Llach 1992, Runyon 1986). A recent prospective, multicentre study showed that primary prophylaxis with norfloxacine may improve survival among patients with CHILD C cirrhosis. However, this was only the case if the ascites protein level was below 1.5 g/dL (Moreau 2018). Norfloxacin is usually recommended for SBP prophylaxis based on the available studies (Angeli 2018, Cohen 2009, Mücke 2020a). Some concerns have been raised about the emergence of infection and in terms of side effects (Mücke 2020b). Rifaximin is an alternative and promising treatment option (Facciorusso 2019, Wang 2019). However, current data remain insufficient to recommend it as the first-line treatment.
Urinary tract infection
UTI are among the most common types of infections in patients with decompensated liver cirrhosis (Fernández 2002, Schultalbers 2020). While the rate of clinical complications and mortality may be lower compared to other sites of infection, UTI may still trigger AKI and ACLF in a considerable proportion of patients (Angeli 2018, Merli 2016, Moreau 2013, Mücke 2018). Antibiotic treatment is generally recommended (Angeli 2018). Similar to SBP, the risk for MDR hast to be considered when choosing the anti-infective drug. However, a prospective randomised study demonstrated that a broad-spectrum antibiotic treatment is only required in case of a severe infections, i.e. sepsis (Merli 2016). For uncomplicated UTI, fosfomycin or nitrofurantoin may be considered as a sufficient treatment attempt (Angeli 2018). The use of albumin is not recommended in the absence of HRS-AKI (Angeli 2018, Guevara 2012, Thévenot 2015).
Pneumonia
Pneumonia is a particularly dangerous form of infection in cirrhosis (Merli 2016). Conversely, the likelihood of mortality in patients with pneumonia is dramatically increased in the presence of liver cirrhosis (Boivin 2019, Di Pasquale 2013). Given the impact of the initial use of an inadequate antibiotic treatment and the considerable risk of MDR in nosocomial infections in these patients, an aggressive approach seems to be reasonable (Piano 2019). Thus, carbapenems could be considered early in nosocomial pneumonia and at least third-generation cephalosporins and/or piperacillin/tacobactam in healthcare-associated pneumonia (Angeli 2018, Jalan 2014a). However, local prevalence of MDR must be taken into account as well. As with other non-SBP infections, the use of albumin is not recommended and it may even complicate pneumonia due to the higher incidence of pleural and pulmonary edema (Angeli 2018, China 2021, Maiwall 2022).
Pulmonary complications
Clinical manifestation and relevance
There are four main pulmonary complications that can be linked to liver cirrhosis. Pneumonia as a result of CAID, hepatic hydrothorax, as atypical localisation of ascites related to small defects in the diaphragm, portopulmonary hypertension (PPHT) and hepatopulmonary syndrome (HPS). Pneumonia/CAID and hepatic hydrothorax/ascites are discussed above. PPHT is defined by an increase in the mean pulmonary arterial pressure (mPAP) to a level of more than 20 mmHg due to increased pulmonary vascular resistance (PVR) in patients with portal hypertension in the absence of other causes of pulmonary hypertension (Simonneau 2019). It may be present in 5-10% of patients with end-stage liver cirrhosis and is associated with poor survival (Colle 2003, Kawut 2008, Krowka 2006, Sussman 2006). Depending on the severity of PPHT, liver cirrhosis as well as cardiac and pulmonary comorbidities, patients may present with severe hypoxia and/or clinical signs of right heart failure (DuBrock 2023). HPS is defined by the presence of chronic liver disease (most commonly cirrhosis), intrapulmonary shunts (IPS) and either hypoxaemia or an increased alveolar-arterial oxygen gradient indicating impairment of intrapulmonary blood oxygenation (Angeli 2018). The presence of HPS is widely underestimated. However, in patients with decompensated cirrhosis, IPS and HPS can be found in up to 50% and 36%, respectively (Mauz 2024). Patients are often asymptomatic but may become clinically apparent with dyspnoea (Angeli 2018, Raevens 2022). However, the most specific symptom is platypnea, i.e. improvement of symptoms when lying down. Of note, HPS impairs survival regardless of the severity of liver disease (Raevens 2022).
Pathogenesis
The pathophysiology of PPHT is still incompletely understood. However, it is hypothesised that portosystemic shunting allows bypassing of the increased vasoactive substances (which are a response to the increased portal pressure, hepatic resistance and inflammation) from the portal tract to the systemic blood circulation. As a result, increased levels of vasoactive substances may also be present in the pulmonary arterial system, leading to vasodilation also at the capillary level. Intrapulmonary blood flow is increased while the capacity for oxygen exchange remains unchanged, resulting in a functional shunting from the right to the left heart. This is thought to be one of the key components of HPS (Thomas 2020, Zaka 2025). In addition, both systemic vasodilation and intrapulmonary result in a hyperdynamic state. Increased blood flow is accompanied by increased shear stress on the endothelial wall. In response, endothelin-1 is secreted leading to smooth muscle cell proliferation and/or increased muscle tone and intimal fibrotic changes (Farber 2004, Porres-Aguilar 2012, Thomas 2020). Ultimately, this may significantly contribute to PHHT (Neuhofer 2006) (Figure 6).
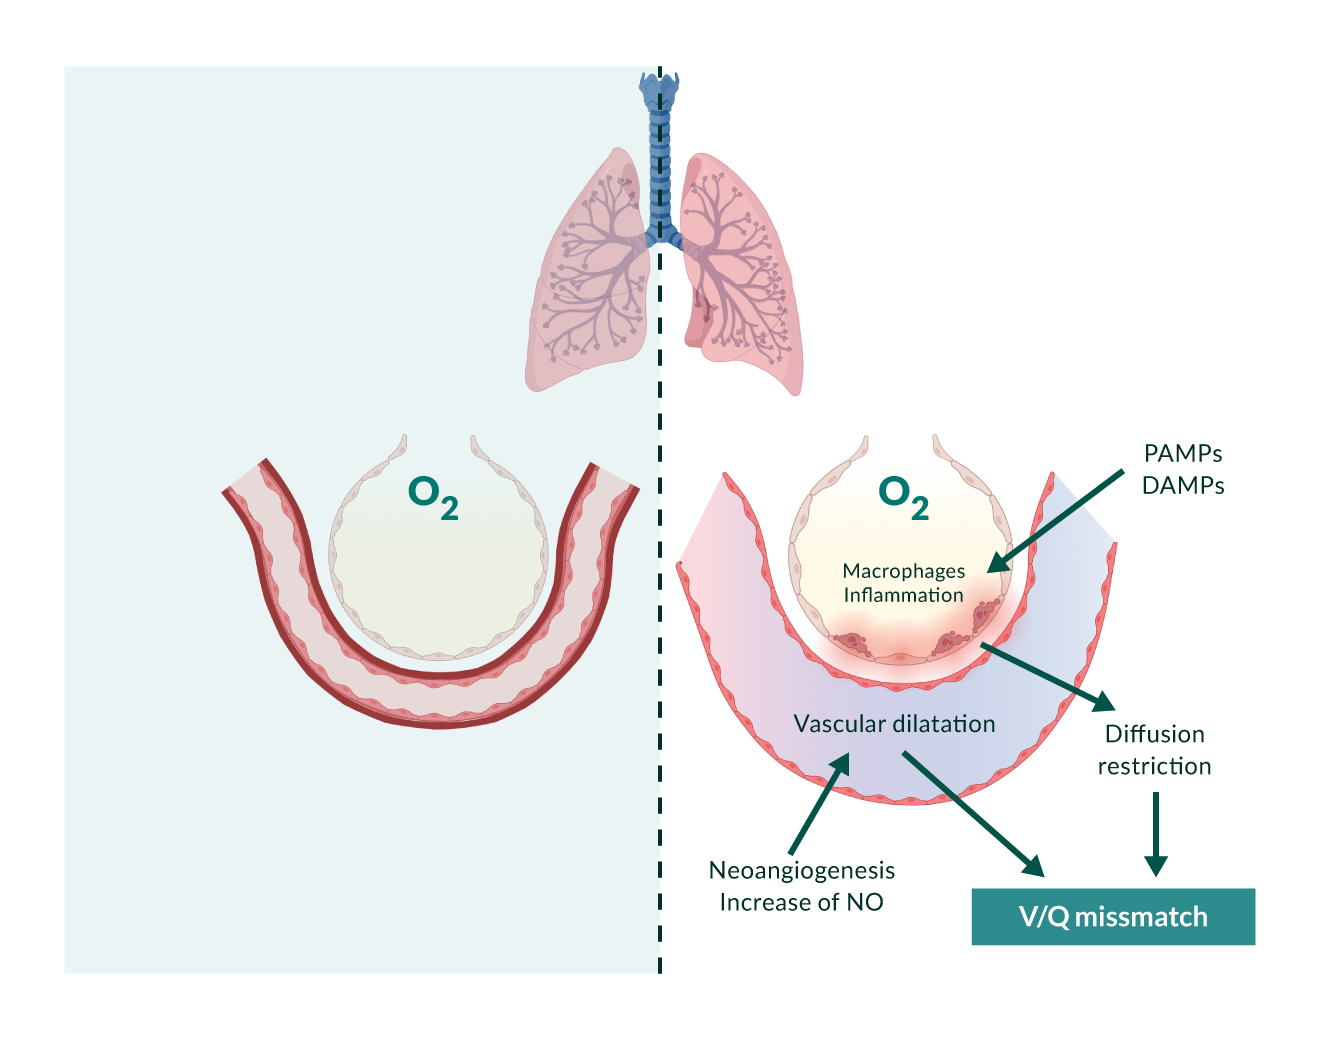 Figure 6.
Diagnostic work-up
PPHT: Elevated right ventricular pressure (>40-50 mmHg) on echocardiography will raise suspicion of PPHT and can be used as a screening criterion for further investigation (DuBrock 2023). However, to establish the diagnosis of PPHT a right heart catheterisation is required. PPHT is characterised by a precapillary pulmonary hypertension. Diagnosic criteria include a mPAP >20 mmHg, pulmonary arterial wedge pressure (PAWP) ≤15 mmHg and PVR ≥2 WU (Humbert 2023). Other causes of PAH need to be excluded. Patients with PAH can be divided into three risk categories, as it is the case for PPHT. The risk categories are defined by clinical symptoms, specific results of echocardiography and hemodynamic parameters (Table 8) (Humbert 2023).
Table 8. Portopulmonary hypertension: Diagnostic criteria| I – Presence of portal hypertension |
| II – Elevated pulmonary arterial pressure compatible with pulmonary hypertension (mPAP in right-heart catheterisation >20 mmHg) |
| III – Increased pulmonary vascular resistance (>240 dyne s-1cm-5; >2 Wood Units) |
| IV – normal pulmonary occlusion pressure (PAWP ≤15 mmHg) |
| V – absence of other causes of pulmonary artery or venosus hypertension hypertension (i.e., chronic thromboembolism, chronic lung disease/hypoxia, chronic left heart disease) |
Abbreviations
mPAP: Mean pulmonary arterial pressure; PAWP: Pulmonary arterial wedge pressure; PVR: Pulmonary vascular resistance.
Citations
Hoeper MM, Krowka MJ, Strassburg CP. Portopulmonary hypertension and hepatopulmonary syndrome. Lancet. 2004 May 1;363(9419):1461-8. doi: 10.1016/S0140-6736(04)16107-2. PMID: 15121411.
European Association for the Study of the Liver. EASL Clinical Practice Guidelines for the management of patients with decompensated cirrhosis. J Hepatol. 2018 Aug;69(2):406-460. doi: 10.1016/j.jhep.2018.03.024. Epub 2018 Apr 10. Erratum in: J Hepatol. 2018 Nov;69(5):1207. doi: 10.1016/j.jhep.2018.08.009. PMID: 29653741.
HPS: Given the high prevalence, all cirrhotic patients with hypoxaemia should undergo screening for HPS. The first step is to assess for IPS. This can be done by contrast-enhanced echocardiography using microbubbles of >10 µm in diameter. In a healthy individual, these bubbles should remain and be absorbed in the pulmonary capillaries. In patients with IPS, bubbles appear in the left heart atrium within 3 to 6 cardiac cycles (Angeli 2018, Raevens 2022). This easy and diagnostic tool cannot be used in the presence of intracardiac shunts (e.g. due to a patent foramen ovale). In this case, bubbles will appear in the left atrium after 1 or 2 cardiac cycles. In patients with IPS, the diagnosis of HPS requires the exclusion of other lung diseases, which usually requires a chest CT scan and functional lung assessments such as maximal forced expiratory volume and carbon monoxide diffusing capacity (Table 9) (Angeli 2018, Raevens 2022).
Table 9. Hepatopulmonary syndrome: Diagnostic criteria| I – Liver disease and/or portal hypertension |
| II – Pulmonary vascular defect with positive finding on contrast-enhanced echocardiography (i.e., microbubble opacification of the left heart chambers three to six cycles after right atrial passage) or abnormal uptake in the brain (>6%) with radioactive lung-perfusion scanning |
| III – Hypoxia with partial pressure of oxygen <80 mmHg or alveolar-arterial oxygen gradient >15 mmHg in ambient air (≥20 mmHg in patients older than 65 years) |
Severity classification of HPS is based on the partial pressure of oxygen in arterial blood gas without supplementary oxygen (PaO2) as mild (PaO2 ≥80 mmHg), moderate (PaO2 60–79 mmHg), severe (PaO2 50–59 mmHg) or very severe (PaO2 <50 mmHg).
Abbreviations
HPS: Hepatopulmonary syndrome; P(A-a)O₂: Alveolar-arterial oxygen gradient; PaO₂: Partial pressure of arterial oxygen; PAO₂: Partial pressure of alveolar oxygen; PaCO₂: Partial pressure of arterial carbon dioxide; FIO₂: Fraction of inspired oxygen; Patm: Atmospheric pressure; PH₂O: Partial pressure of water vapor at body temperature.
Citations
European Association for the Study of the Liver. EASL Clinical Practice Guidelines for the management of patients with decompensated cirrhosis. J Hepatol. 2018 Aug;69(2):406-460. doi: 10.1016/j.jhep.2018.03.024. Epub 2018 Apr 10. Erratum in: J Hepatol. 2018 Nov;69(5):1207. doi: 10.1016/j.jhep.2018.08.009. PMID: 29653741.
Raevens S, Boret M, Fallon MB. Hepatopulmonary syndrome. JHEP Rep. 2022 Jul 4;4(9):100527. doi: 10.1016/j.jhepr.2022.100527. PMID: 36035361; PMCID: PMC9403489.
Treatment
PPHT: In general, treatment strategy follows the clinical assessment of the risk category and the presence or absence of cardiovascular comorbidities (Humbert 2023). Medical treatment options include endothelin receptor antagonists, phosphodiesterase subtype 5 inhibitors and prostacyclin analouges (Angeli 2018, Humbert 2023). However, while treatment is associated with improvement in hemodynamic parameters, all of these drugs can lead to decrease in systemic arterial pressure, which limits their tolerability in advanced liver cirrhosis, particularly when combination treatment is required (DuBrock 2023, Savale 2020). Best treatment results can be achieved by liver transplantation (Savale 2020). However, not all patients are suitable candidates, mainly because of the risk of right heart failure. Patients with mPAP of > 45-50 mmHg at the time of liver transplantation, have a posttransplant mortality of up to 100% (Krowka 2000). In contrast, transplantation appears to be safe in patients with mPAP of < 35 mmHg or of 35-45 mmHg but a PVR of < 3 WU (Angeli 2018, DuBrock 2023).
HPS: Up till now, there is no pharmacological treatment available. Patients with hypoxaemia can be treated with continuous oxygen supply (Angeli 2018, Raevens 2022). Moreover, coil embolisation of ateriovenous malformations has been suggested. However, complications such as pulmonary infarction and infections need to be considered (Grady 2015). Liver transplantation remains the only effective treatment option. Although perioperative mortality is higher compared with non-HPS patients, arterial oxygenation and six-minute walk distance significantly improves significantly. Recent data suggest that HPS can be expected to resolve in approximately 95% of cases (Aragon Pinto 2021, Raevens 2022).
Acute-on-chronic liver failure
Clinical manifestation and relevance
The poor prognosis of liver cirrhosis (Lange 2023) is particularly due to acute decompensations (AD), which represent a situational worsening of the disease state (Jalan 2021). These are characterised by the rapid onset of ascites, gastrointestinal bleeding, hepatic encephalopathy, bacterial infections, or a combination of these complications (Gu 2022). The CANONIC study demonstrated that there is a subgroup of patients with acutely decompensated liver cirrhosis who have a significantly worse prognosis (Moreau 2013). This subgroup of patients was termed ACLF, which is the most severe form of acute decompensation (Schulz 2022). ACLF was defined by the European Association for the Study of the Liver (EASL)–Chronic Liver Failure (CLIF) Consortium based on the results of the CANONIC study. The CANONIC study is a prospective observational study involving more than 1300 patients with acute decompensation (Moreau 2013). Various organ systems were classified into organ failure or organ dysfunction based on clinical and laboratory parameters. Analogous to the Sequential Organ Failure Assessment (SOFA) Score, the CLIF-C Organ Failure (OF) Score was calculated (https://www.efclif.com/scientific-activity/score-calculators/clif-c-aclf). This score includes the function of the liver and kidneys (creatinine and bilirubin levels), cognition (West Haven criteria), circulation (MAP and catecholamine requirement), and coagulation (INR) (Table 10).
Table 10.| Organ system | Diagnostic criterium | Points | ||
| 1 | 2 | 3 | ||
 |
Bilirubin | <106 µmol/L | 106–205 µmol/L | >205 µmol/L |
| <6 mg/d | 6–12 mg/dL | >12 mg/dL | ||
 |
Creatinine | <177 µmol/L | 177–310 µmol/L | >310 µmol/L |
| <2 mg/dL | 2–3.5 mg/dL | >3.5 mg/dL | ||
 |
Hepatic encephalopathy | Grade 0 (WH) | Grade I, II (WH) | Grade III, IV (WH) |
 |
INR | <2.0 | 2.0–2.4 | ≥2.5 |
 |
Mean arterial pressure | >70 mmHg | <70 mmHg | Vasopressors |
 |
SpO2/FiO2 | >357 | 214–357 | ≥214 |
| paO2/FiO2 | >300 | 300–200 | <200 | |
Organ failure is defined as a score of 3 in the respective organ system. An exception is made for the kidneys, where organ failure is defined with a CLIF-C-OF score of 2 (corresponding to a creatinine level of > 2 mg/dL) (Jalan 2014b) (Figure 7). Patients with more than one organ failure or isolated kidney failure meet the criteria for ACLF. Additionally, isolated organ failures combined with kidney dysfunction (creatinine 1.5–1.9 mg/dL) or hepatic encephalopathy (grade I/II) are classified as ACLF Grade I. Patients with two manifest organ failures show ACLF Grade II, and those with three or more organ failures have ACLF Grade III. The 28-day mortality rate increases with the grade, reaching 68% in patients with four or more organ failures (Arroyo 2020) (Figure 10). A more precise prognosis for ACLF can be made using the CLIF-C ACLF Score, which also considers age and leukocyte count (Jalan 2014b). Although the EASL-CLIF definition has been validated worldwide, two other definitions exist in the USA and Asia: the North American Consortium for the Study of End-stage Liver Disease (NACSELD) and the Asian Pacific Association for the Study of the Liver (APASL). Both definitions are similar to the EASL-CLIF, with the distinction that NACSELD defines ACLF only when there are two manifest organ failures, whereas APASL does not consider extrahepatic triggers and organ failures (Arroyo 2020).
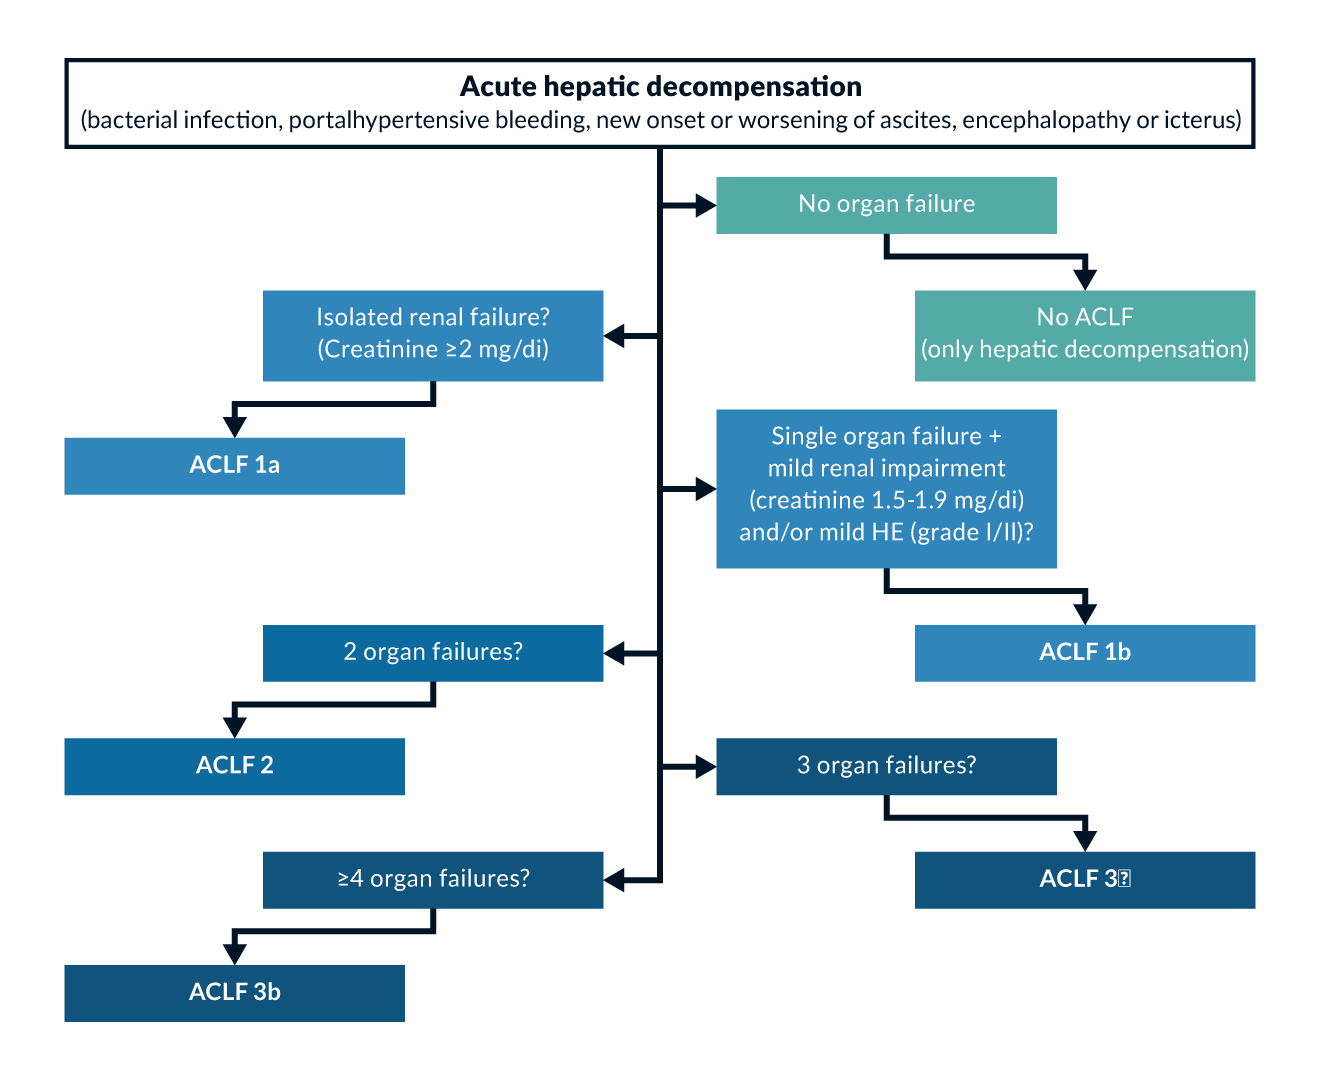 Figure 7.
Pathogenesis
ACLF affects approximately one in four patients (23%) hospitalised for decompensated liver cirrhosis. About 20% of patients admitted without ACLF develop ACLF within the following 90 days (so-called pre-ACLF), with 60% of these cases occurring within the next three weeks, as shown in the PREDICT study (Trebicka 2020b). Pre-ACLF patients exhibit a significantly elevated inflammatory profile (increased leukocyte counts and CRP levels) (Trebicka 2020b). Risk factors for the development of ACLF include the presence of ascites, low mean arterial pressure, anaemia, and a high MELD score. In addition, younger patients appear to be more commonly affected (Angeli 2018). The onset of ACLF is primarily attributed to two pathophysiological phenomena: portal hypertension and systemic inflammation (Trebicka 2020b). Patients with ACLF show significantly higher concentrations of pro-inflammatory cytokines (Trebicka 2019a). The occurrence of events, especially infections, severe gastrointestinal bleeding, or alcoholic hepatitis, can lead to further reductions in effective blood volume, thereby inducing hypoperfusion of various organs (Trebicka 2021a). The kidney and brain are particularly early affected, thus playing a special role in the definition of dysfunction. These events are known as precipitating factors or triggers and play a crucial role in the prevention and treatment of ACLF. However, in 40% of cases no trigger can be identified (Trebicka 2021a).
Diagnostic work-up and treatment of triggers
A trigger can be identified in 60% of patients with ACLF (Trebicka 2021a). Possible triggers include liver-related factors such as alcoholic steatohepatitis (ASH) or a flare of viral hepatitis, as well as extrahepatic triggers such as infections. Combinations are also not uncommon (Trebicka 2021a). Any patient admitted with ACLF or who develops ACLF during hospitalisation should undergo a systematic examination for the presence of the most common triggers, including documented bacterial infections, alcohol-related hepatitis, gastrointestinal bleeding with hemodynamic instability, a flare of hepatitis B virus infection, recent intake of medication known to cause brain failure, and recent intake of medication known to cause kidney failure (Figure 8) (Moreau 2023).
Patients for whom systematic examination fails to identify expected triggers should be investigated based on clinical context and using a comprehensive list of all potential unusual cases (Figure 8) (Moreau 2023). The causal treatment of potential triggers plays a key role in preventing ACLF, as no specific preventive therapy has been established so far (Angeli 2018, Moreau 2023). The concepts of treating the most critical triggers are outlined below.
Infections can represent both a trigger and a complication of ACLF. Typically, these are bacterial infections, less commonly mycoses. When choosing antibiotic therapy, patient-specific factors, the suspected focus, and local resistance patterns should be considered (see above) (Moreau 2023). Patients with ACLF and suspected bacterial infections should receive broad-spectrum empirical antibiotic therapy as soon as possible, in line with local epidemiology. A rapid and comprehensive evaluation for infection is recommended for patients with ACLF and suspected bacterial infections (Moreau 2023). An empirical antifungal therapy may be indicated for ACLF patients developing nosocomial septic shock with additional risk factors for fungal infection (Moreau 2023).
One of the most common triggers in Western countries is alcoholic hepatitis due to active alcoholism or an alcohol binge. Here, corticosteroids remain the treatment of choice, although their efficacy is still under debate. Severe cases with increased short-term mortality can be identified using the modified Maddrey score. In cases with a score > 32, steroid therapy with 40 mg of prednisolone/day can be initiated. Due to potential steroid-associated side effects, identifying patients who do not benefit from steroid therapy is essential. This can be assessed using the Lille score, calculated based on age, albumin, prothrombin time, creatinine, and bilirubin levels at the start and after seven days of prednisolone therapy (Trebicka 2022). With increasing severity of ACLF, the response to corticosteroids decreases, while the risk of infection increases. Therefore, corticosteroids are not recommended for patients with severe alcoholic hepatitis and ACLF-3, nor for patients with uncontrolled bacterial infections. If corticosteroids are administered to patients with severe alcoholic hepatitis and ACLF, close monitoring for infections is necessary (Moreau 2023, Trebicka 2022).
Acute variceal bleeding, accounting for 70% of upper gastrointestinal bleeding episodes in cirrhosis, has been identified as a common cause of death and ACLF in cirrhotic patients. Recent treatment advances, including endoscopic treatment, pharmacotherapy, and TIPS, have led to a decrease in the frequency of variceal bleeding over the past decade. However, ACLF significantly worsens survival in these patients. Indeed, ACLF doubles the risk of rebleeding and serves as a simple criterion for identifying patients at risk of rebleeding (Moreau 2023). Two independent studies have shown that TIPS, either preemptive/early or emergency, improves survival in patients with ACLF-1 or ACLF-2 and variceal bleeding, although few patients with ACLF-3 were included in these studies (Kumar 2021, Trebicka 2020a). Therefore, TIPS should be considered in the treatment of patients with ACLF and variceal bleeding, even in those with bilirubin levels over 5 mg/dL. As a result, affected patients should be transferred to hospitals with access to TIPS, potentially reducing their mortality rate by up to 75%. This data is well supported by a recent study showing that the survival benefit from preemptive/early TIPS increases with a higher MELD score (Moreau 2023).
Other triggers can include a flare of known viral hepatitis. Acute infections with hepatitis A or E can also be potential triggers. Therefore, patients with liver cirrhosis should be vaccinated against hepatitis A and B as appropriate (Moreau 2023). For patients with HBV-related ACLF, the use of nucleoside analogues is recommended as the treatment of choice (Moreau 2023).
Drug-induced liver injury (DILI) is often implicated as a potential trigger. Physicians should especially inquire about recent new medications, including over-the-counter, natural remedies, and dietary supplements (Moreau 2023).
There is a high likelihood of having more than one trigger in patients with ACLF. Identifying these triggers is crucial for targeted treatment and preventing disease progression. Therefore, it is important to differentiate between the treatment of trigger-related complications and the treatment of ACLF itself (Moreau 2023).
Specific therapy and supportive measures
Specific therapy for ACLF aims to address the pathophysiology, particularly the inflammatory response. To date, only the use of Albumin is evidence-based in ACLF. Albumin binds to endotoxins and acts as a scavenger of reactive oxygen species. Its effectiveness is likely due to its positive effect on hemodynamics and inflammatory response (Klein 2020).
The ANSWER study demonstrated the positive effects of long-term albumin therapy in patients with decompensated liver cirrhosis. Patients who received weekly albumin infusions in addition to standard therapy showed significantly improved transplant-free survival. Additionally, fewer severe infections and complications occurred (Caraceni 2018a).
The ATTIRE study did not show a benefit of albumin infusion on 28-day mortality in patients with decompensated liver cirrhosis, despite achieving normal albumin levels. This study did not explicitly differentiate between patients with ACLF and those with AD. However, there was a lower number of patients with new or existing organ failures among patients who achieved normal albumin levels (China 2021). The RESOLVE trial, currently enrolling patients, aims to clarify the significance of long-term albumin therapy in patients with ACLF.
As albumin levels and concentrations are often significantly reduced in patients with ACLF, albumin infusion is recommended for treating ascites, prevention of HRS, and in cases of confirmed SBP.
Patients with ACLF, particularly those in ACLF Grade III, require intensive care. Guidelines for supportive therapy are not specific to ACLF and are derived from those for severe sepsis and multiple organ failure in non-cirrhotic patients. However, significant differences exist in the application of general guidelines to patients with liver cirrhosis. (Gustot 2015). Special attention is given to the risk of overhydration and tissue edema. To maintain adequate organ perfusion, slightly increased MAP values should be targeted. Isotonic crystalloids should be preferred over colloids in volume resuscitation (Gustot 2015, Garnacho-Montero 2015). Vasopressor use, especially norepinephrine, should be considered early in ACLF patients with septic shock (Choudhury 2017). Non-invasive ventilation (NIV) and extracorporeal membrane oxygenation (ECMO) are considered in patients with respiratory failure, while renal replacement therapy is indicated in cases of renal failure, particularly in the presence of HRS or metabolic complications (Moreau 2023).
Liver transplantation remains the definitive treatment for patients with ACLF, offering potential for improved survival and quality of life. Early evaluation for liver transplantation is recommended, especially in patients with ACLF Grade II and III (Moreau 2023, Trebicka 2020c).
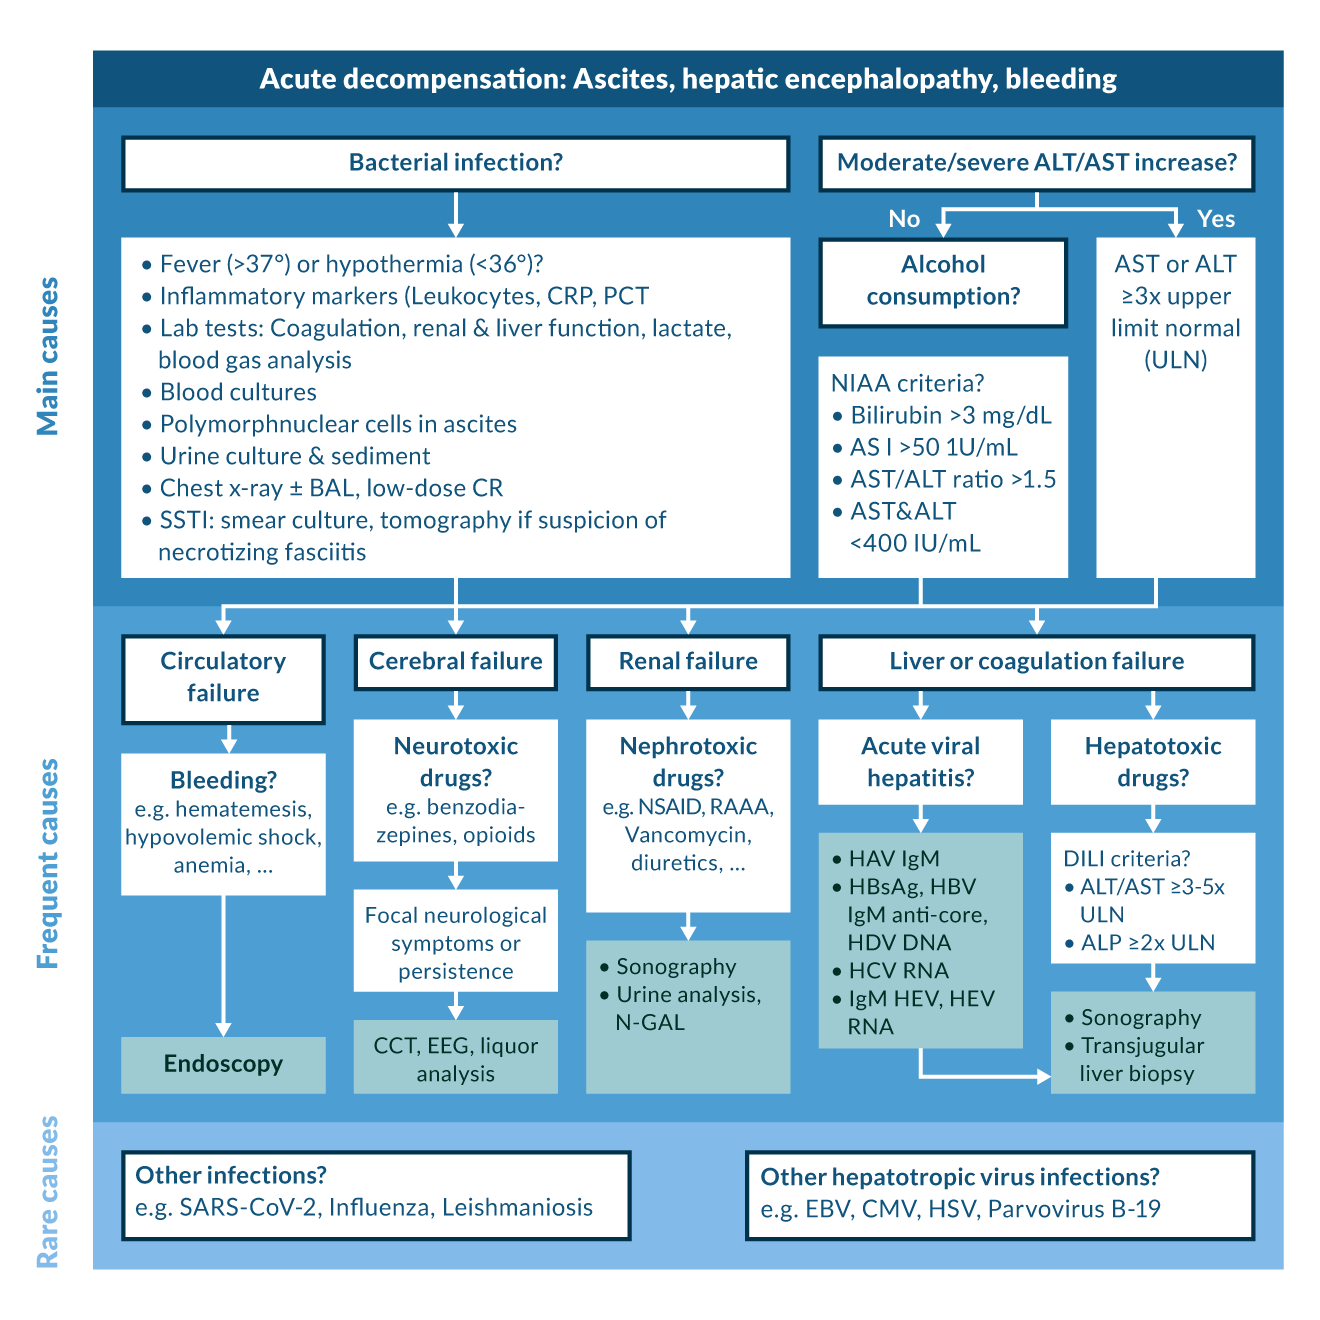 Figure 8.
Acknowledgements
The authors thank Julius Egge, Laura Buttler, Martin Kabelitz, Jim Mauz, Sarah Schütte and Lea Wagner for their assistance regarding figure and table design.
References
Abraldes JG, Bureau C, Stefanescu H, Augustin S, Ney M, Blasco H, Procopet B, Bosch J, Genesca J, Berzigotti A. 2016. Noninvasive tools and risk of clinically significant portal hypertension and varices in compensated cirrhosis: The “anticipate” study. Hepatology. 64(6):2173–84.
Acharya C, Shaw J, Duong N, Fagan A, McGeorge S, Wade JB, Thacker LR, Bajaj JS. 2023. QuickStroop, a shortened version of EncephalApp, detects covert hepatic encephalopathy with similar accuracy within one minute. Clin Gastroenterol Hepatol. 21(1):136–42.
Adebayo D, Wong F. 2023. Pathophysiology of hepatorenal syndrome – acute kidney injury. Clin Gastroenterol Hepatol. 21(10):S1–S10.
Afolabi A, Kayani A, Simmons J, Soomro M, Veitch A, Henry D, Gray R, Edwards P, Manno D, Austin E, et al. 2020. Effects of a high-dose 24-h infusion of tranexamic acid on death and thromboembolic events in patients with acute gastrointestinal bleeding (HALT-IT): An international randomised, double-blind, placebo-controlled trial. The Lancet. 395(10241):1927–36.
Agrawal S, Umapathy S, Dhiman RK. 2015. Minimal hepatic encephalopathy impairs quality of life. J Clin Exp Hepatol. 5(Suppl 1):S42–8.
Albillos A, Lario M, Álvarez-Mon M. 2014. Cirrhosis-associated immune dysfunction: Distinctive features and clinical relevance. J Hepatol. 61(6):1385–96.
Albillos A, Martin-Mateos R, Van der Merwe S, Wiest R, Jalan R, Álvarez-Mon M. 2022. Cirrhosis-associated immune dysfunction. Nat Rev Gastroenterol Hepatol. 19(2):112–34.
Als-Nielsen B, Gluud LL, Gluud C. 2004. Non-absorbable disaccharides for hepatic encephalopathy: Systematic review of randomised trials. BMJ. 328(7447):1046–50.
Angeli P, Fasolato S, Mazza E, Okolicsanyi L, Maresio G, Velo E, Galioto A, Salinas F, D’Aquino M, Sticca A, et al. 2010. Combined versus sequential diuretic treatment of ascites in non-azotaemic patients with cirrhosis: Results of an open randomised clinical trial. Gut. 59(1):98–104.
Angeli P, Bernardi M, Villanueva C, Francoz C, Mookerjee RP, Trebicka J, Krag A, Laleman W, Gines P. 2018. EASL clinical practice guidelines for the management of patients with decompensated cirrhosis. J Hepatol. 69(2):406–60.
Aragon Pinto C, Iyer VN, Albitar HAH, Anderson A, Cajigas H, Simonetto DA, Krowka MJ, DuBrock HM, Gallo de Moraes A. 2021. Outcomes of liver transplantation in patients with hepatopulmonary syndrome in the pre and post-MELD eras: A systematic review. Respir Med and Res. 80:100852.
Arroyo V, Ginès P, Gerbes AL, Dudley FJ, Gentilini P, Laffi G, Reynolds TB, Ring‐Larsen H, Schölmerich J. 1996a. Definition and diagnostic criteria of refractory ascites and hepatorenal syndrome in cirrhosis. Hepatology. 23(1):164–76.
Arroyo V, Fernandez-Esparrach G, Gines P. 1996b. Diagnostic approach to the cirrhotic patient with ascites. Oxford: Elsevier. 35 p.
Arroyo V, Moreau R, Jalan R, Ginès P. 2015. Acute-on-chronic liver failure: A new syndrome that will re-classify cirrhosis. J Hepatol. 62(1):S131–43.
Arroyo V, Moreau R, Jalan R. 2020. Acute-on-chronic liver failure. N Engl J Med. 382(22):2137–45.
Arvaniti V, D'Amico G, Fede G, Manousou P, Tsochatzis E, Pleguezuelo M, Burroughs AK. 2010. Infections in patients with cirrhosis increase mortality four-fold and should be used in determining prognosis. Gastroenterology. 139(4):1246,1256.e5.
Avgerinos A, Nevens F, Raptis S, Fevery J. 1997. Early administration of somatostatin and efficacy of sclerotherapy in acute oesophageal variceal bleeds: The european acute bleeding oesophageal variceal episodes (ABOVE) randomised trial. Lancet. 350(9090):1495–9.
Azam Z, Hamid S, Jafri W, Salih M, Abbas Z, Abid S, Shah H. 2012. Short course adjuvant terlipressin in acute variceal bleeding: A randomized double blind dummy controlled trial. J Hepatol. 56(4):819–24.
Bajaj JS, O’Leary JG, Reddy KR, Wong F, Olson JC, Subramanian RM, Brown G, Noble NA, Thacker LR, Kamath PS. 2012. Second infections independently increase mortality in hospitalized cirrhotic patients: The NACSELD experience. Hepatology. 56(6):2328–35.
Bajaj JS, Kassam Z, Fagan A, Gavis EA, Liu E, Cox IJ, Kheradman R, Heuman D, Wang J, Gurry T, et al. 2017. Fecal microbiota transplant from a rational stool donor improves hepatic encephalopathy: A randomized clinical trial. Hepatology. 66(6):1727–38.
Bajaj JS, Salzman NH, Acharya C, Sterling RK, White MB, Gavis EA, Fagan A, Hayward M, Holtz ML, Matherly S, et al. 2019. Fecal microbial transplant capsules are safe in hepatic encephalopathy: A phase 1, randomized, Placebo‐Controlled trial. Hepatology. 70(5):1690–703.
Ballester MP, Tranah TH, Balcar L, Fiorillo A, Ampuero J, Kerbert AJC, Thomsen KL, Escudero MD, Mandorfer M, Reiberger T, et al. 2023. Development and validation of the AMMON-OHE model to predict risk of overt hepatic encephalopathy occurrence in outpatients with cirrhosis. J Hepatol. 79(4):967–76.
Barros N, Rosenblatt RE, Phipps MM, Fomin V, Mansour MK. 2023. Invasive fungal infections in liver diseases. Hepatol Commun. 7(9):e0216.
Basho K, Zoldan K, Schultheiss M, Bettinger D, Globig A, Bengsch B, Neumann-Haefelin C, Klocperk A, Warnatz K, Hofmann M, et al. 2021. IL-2 contributes to cirrhosis-associated immune dysfunction by impairing follicular T helper cells in advanced cirrhosis. J Hepatol. 74(3):649–60.
Bass NM, Mullen KD, Sanyal A, Poordad F, Neff G, Leevy CB, Sigal S, Sheikh MY, Beavers K, Frederick T, et al. 2010. Rifaximin treatment in hepatic encephalopathy. N Engl J Med. 362(12):1071–81.
Bellot P, Welker M, Soriano G, von Schaewen M, Appenrodt B, Wiest R, Whittaker S, Tzonev R, Handshiev S, Verslype C, et al. 2013. Automated low flow pump system for the treatment of refractory ascites: A multi-center safety and efficacy study. J Hepatol. 58(5):922–7.
Benvegnù L, Gios M, Boccato S, Alberti A. 2004. Natural history of compensated viral cirrhosis: A prospective study on the incidence and hierarchy of major complications. Gut. 53(5):744–9.
Berlioux P, Robic MA, Poirson H, Métivier S, Otal P, Barret C, Lopez F, Péron JM, Vinel JP, Bureau C. 2014. Pre‐transjugular intrahepatic portosystemic shunts (TIPS) prediction of post‐TIPS overt hepatic encephalopathy: The critical flicker frequency is more accurate than psychometric tests. Hepatology. 59(2):622–9.
Bernard B, Cadranel J, Valla D, Escolano S, Jarlier V, Opolon P. 1995. Prognostic significance of bacterial infection in bleeding cirrhotic patients: A prospective study. Gastroenterology. 108(6):1828–34.
Bernard B, Grangé J, Khac EN, Amiot X, Opolon P, Poynard T. 1999. Antibiotic prophylaxis for the prevention of bacterial infections in cirrhotic patients with gastrointestinal bleeding: A meta‐analysis. Hepatology. 29(6):1655–61.
Bernardi M, Caraceni P, Navickis RJ, Wilkes MM. 2012. Albumin infusion in patients undergoing large-volume paracentesis: A meta-analysis of randomized trials. Hepatology. 55(4):1172–81.
Berres M, Asmacher S, Lehmann J, Jansen C, Görtzen J, Klein S, Meyer C, Strunk HM, Fimmers R, Tacke F, et al. 2015. CXCL9 is a prognostic marker in patients with liver cirrhosis receiving transjugular intrahepatic portosystemic shunt. J Hepatol. 62(2):332–9.
Bettinger D, Sturm L, Pfaff L, Hahn F, Kloeckner R, Volkwein L, Praktiknjo M, Lv Y, Han G, Huber JP, et al. 2021. Refining prediction of survival after TIPS with the novel freiburg index of post-TIPS survival. J Hepatol. 74(6):1362–72.
Billey C, Billet S, Robic MA, Cognet T, Guillaume M, Vinel JP, Péron JM, Lairez O, Bureau C. 2019. A prospective study identifying predictive factors of cardiac decompensation after transjugular intrahepatic portosystemic shunt: The toulouse algorithm. Hepatology. 70(6):1928–41.
Boivin Z, Perez MF, Atuegwu NC, Anzueto A, Mortensen EM. 2019. Impact of cirrhosis on pneumonia-related outcomes in hospitalized older veterans. Am J Med Sci. 357(4):296–301.
Bureau C, Garcia-Pagan Jc, Otal P, Pomier-Layrargues G, Chabbert V, Cortez C, Perreault P, Péron Jm, G. Abraldes J, Bouchard L, et al. 2004. Improved clinical outcome using polytetrafluoroethylene-coated stents for tips: Results of a randomized study. Gastroenterology. 126(2):469–75.
Bureau C, Métivier S, D’Amico M, Péron JM, Otal P, Pagan JCG, Chabbert V, Chagneau-Derrode C, Procopet B, Rousseau H, et al. 2011. Serum bilirubin and platelet count: A simple predictive model for survival in patients with refractory ascites treated by TIPS. J Hepatol. 54(5):901–7.
Bureau C, Thabut D, Oberti F, Dharancy S, Carbonell N, Bouvier A, Mathurin P, Otal P, Cabarrou P, Péron JM, et al. 2017a. Transjugular intrahepatic portosystemic shunts with covered stents increase transplant-free survival of patients with cirrhosis and recurrent ascites. Gastroenterology. 152(1):157–63.
Bureau C, Adebayo D, de Rieu MC, Elkrief L, Valla D, Peck-Radosavljevic M, McCune A, Vargas V, Simon-Talero M, Cordoba J, et al. 2017b. Alfapump system vs. large volume paracentesis for refractory ascites: A multicenter randomized controlled study. J Hepatol. 67(5):940–9.
Bureau C, Thabut D, Jezequel C, Archambeaud I, D'Alteroche L, Dharancy S, Borentain P, Oberti F, Plessier A, De Ledinghen V, et al. 2021. The use of rifaximin in the prevention of overt hepatic encephalopathy after transjugular intrahepatic portosystemic shunt : A randomized controlled trial. Ann Intern Med. 174(5):633–40.
Cai W, Zheng B, Lin X, Wu W, Chen C. 2022. Prediction of patient hepatic encephalopathy risk with freiburg index of post-TIPS survival score following transjugular intrahepatic portosystemic shunts: A retrospective study. Int J Gen Med. 15:4007–16.
Campagna F, Montagnese S, Ridola L, Senzolo M, Schiff S, De Rui M, Pasquale C, Nardelli S, Pentassuglio I, Merkel C, et al. 2017. The animal naming test: An easy tool for the assessment of hepatic encephalopathy. Hepatology. 66(1):198–208.
Caraceni P, Riggio O, Angeli P, Alessandria C, Neri S, Foschi FG, Levantesi F, Airoldi A, Boccia S, Svegliati-Baroni G, et al. 2018a. Long-term albumin administration in decompensated cirrhosis (ANSWER): An open-label randomised trial. Lancet. 391(10138):2417–29.
Caraceni P, Riggio O, Angeli P, et al. 2018b. Long-term albumin administration in decompensated cirrhosis (ANSWER): an open-label randomised trial [published correction appears in Lancet. 2018 Aug 4;392(10145):386. Lancet. 2018;391(10138):2417-2429.
caraCárdenas A, Ginès P, Uriz J, Bessa X, Salmerón JM, Mas A, Ortega R, Calahorra B, De Las Heras D, Bosch J, et al. 2001. Renal failure after upper gastrointestinal bleeding in cirrhosis: Incidence, clinical course, predictive factors, and short-term prognosis. Hepatology. 34(4):671–6.
Cavallin M, Piano S, Romano A, Fasolato S, Frigo AC, Benetti G, Gola E, Morando F, Stanco M, Rosi S, et al. 2016. Terlipressin given by continuous intravenous infusion versus intravenous boluses in the treatment of hepatorenal syndrome: A randomized controlled study. Hepatology. 63(3):983–92.
Chalasani N, Kahi C, Francois F, Pinto A, Marathe A, Bini EJ, Pandya P, Sitaraman S, Shen J. 2003. Improved patient survival after acute variceal bleeding: A multicenter, cohort study. Am J Gastroenterol. 98(3):653–9.
China L, Freemantle N, Forrest E, Kallis Y, Ryder SD, Wright G, Portal AJ, Becares Salles N, Gilroy DW, O’Brien A. 2021. A randomized trial of albumin infusions in hospitalized patients with cirrhosis. N Engl J Med. 384(9):808–17.
Choudhury A, Kedarisetty CK, Vashishtha C, Saini D, Kumar S, Maiwall R, Sharma MK, Bhadoria AS, Kumar G, Joshi YK, et al. 2017. A randomized trial comparing terlipressin and noradrenaline in patients with cirrhosis and septic shock. Liver Int. 37(4):552–61.
Cohen MJ, Sahar T, Benenson S, Elinav E, Brezis M, Soares‐Weiser K, Cohen MJ. 2009. Antibiotic prophylaxis for spontaneous bacterial peritonitis in cirrhotic patients with ascites, without gastro‐intestinal bleeding. Cochrane Database Syst Rev. 2010(1):CD004791.
Colle IO, Moreau R, Godinho E, Belghiti J, Ettori F, Cohen-Solal A, Mal H, Bernuau J, Marty J, Lebrec D, et al. 2003. Diagnosis of portopulmonary hypertension in candidates for liver transplantation: A prospective study. Hepatology. 37(2):401–9.
Costa D, Simbrunner B, Jachs M, Hartl L, Bauer D, Paternostro R, Schwabl P, Scheiner B, Stättermayer AF, Pinter M, et al. 2021. Systemic inflammation increases across distinct stages of advanced chronic liver disease and correlates with decompensation and mortality. J Hepatol. 74(4):819–28.
Dajti E, Ravaioli F, Marasco G, Alemanni LV, Colecchia L, Ferrarese A, Cusumano C, Gemini S, Vestito A, Renzulli M, et al. 2022. A combined baveno VII and spleen stiffness algorithm to improve the noninvasive diagnosis of clinically significant portal hypertension in patients with compensated advanced chronic liver disease. Am J Gastroenterol. 117(11):1825–33.
D'Amico G, Lucas A. 1997. Natural history. clinical-haemodynamic correlations. prediction of the risk of bleeding. Baillieres Clin Gastroenterol. 11(2):243–56.
D'Amico G, Garcia-Tsao G, Pagliaro L. 2006. Natural history and prognostic indicators of survival in cirrhosis: A systematic review of 118 studies. J Hepatol. 44(1):217–31.
D'Amico G, Pasta L, Morabito A, D'Amico M, Caltagirone M, Malizia G, Tinè F, Giannuoli G, Traina M, Vizzini G, et al. 2014. Competing risks and prognostic stages of cirrhosis: A 25‐year inception cohort study of 494 patients. Aliment Pharmacol Ther. 39(10):1180–93.
D'Amico G, Morabito A, D'Amico M, Pasta L, Malizia G, Rebora P, Valsecchi MG. 2018. Clinical states of cirrhosis and competing risks. J Hepatol. 68(3):563–76.
de Franchis R, Bosch J, Garcia-Tsao G, Reiberger T, Ripoll C, Abraldes JG, Albillos A, Baiges A, Bajaj J, Bañares R, et al. 2022. Baveno VII – renewing consensus in portal hypertension. J Hepatol. 76(4):959–74.
Dell'Era A, MD, de Franchis R, MD, Iannuzzi F, MD. 2008. Acute variceal bleeding: Pharmacological treatment and primary/secondary prophylaxis. Best Pract Res Clin Gastroenterol. 22(2):279–94.
Di Pasquale M, Esperatti M, Crisafulli E, Ferrer M, Bassi GL, Rinaudo M, Escorsell A, Fernandez J, Mas A, Blasi F, et al. 2013. Impact of chronic liver disease in intensive care unit acquired pneumonia: A prospective study. Intensive Care Med. 39(10):1776–84.
Duan Y, Llorente C, Lang S, Brandl K, Chu H, Jiang L, White RC, Clarke TH, Nguyen K, Torralba M, et al. 2019. Bacteriophage targeting of gut bacterium attenuates alcoholic liver disease. Nature. 575(7783):505–11.
DuBrock HM. 2023. Portopulmonary hypertension: Management and liver transplantation evaluation. Chest. 164(1):206–14.
Ehrenbauer AF, Schneider H, Stockhoff L, Tiede A, Lorenz C, Dirks M, Witt J, Gabriel MM, Wedemeyer H, Hinrichs JB, et al. 2023. Predicting overt hepatic encephalopathy after TIPS: Value of three minimal hepatic encephalopathy tests. JHEP Rep. 5(9):100829.
Ehrenbauer AF, Egge JFM, Gabriel MM, Tiede A, Dirks M, Witt J, Wedemeyer H, Maasoumy B, Weissenborn K. 2024. Comparison of 6 tests for diagnosing minimal hepatic encephalopathy and predicting clinical outcome: A prospective, observational study. Hepatology. 80(2):389-402.
Elkington SG, Floch MH, Conn HO. 1969. Lactulose in the treatment of chronic portal-systemic encephalopathy. N Engl J Med. 281(8):408–12.
Engelmann C, Clària J, Szabo G, Bosch J, Bernardi M. 2021. Pathophysiology of decompensated cirrhosis: Portal hypertension, circulatory dysfunction, inflammation, metabolism and mitochondrial dysfunction. J Hepatol. 75(Suppl 1):S49–66.
Escorsell À, Pavel O, Cárdenas A, Morillas R, Llop E, Villanueva C, Garcia-Pagán JC, Bosch J. 2016. Esophageal balloon tamponade versus esophageal stent in controlling acute refractory variceal bleeding: A multicenter randomized, controlled trial. Hepatology. 63(6):1957–67.
Facciorusso A, Papagiouvanni I, Cela M, Buccino VR, Sacco R. 2019. Comparative efficacy of long‐term antibiotic treatments in the primary prophylaxis of spontaneous bacterial peritonitis. Liver Int. 39(8):1448–58.
Farber HW, Loscalzo J. 2004. Pulmonary arterial hypertension. N Engl J Med. 351(16):1655–65.
Fernández J, Navasa M, Gómez J, Colmenero J, Vila J, Arroyo V, Rodés J. 2002. Bacterial infections in cirrhosis: Epidemiological changes with invasive procedures and norfloxacin prophylaxis. Hepatology. 35(1):140–8.
Fernández J, Navasa M, Planas R, Montoliu S, Monfort D, Soriano G, Vila C, Pardo A, Quintero E, Vargas V, et al. 2007. Primary prophylaxis of spontaneous bacterial peritonitis delays hepatorenal syndrome and improves survival in cirrhosis. Gastroenterology. 133(3):818–24.
Fernández J, Acevedo J, Castro M, Garcia O, Rodríguez de Lope C, Roca D, Pavesi M, Sola E, Moreira L, Silva A, et al. 2012. Prevalence and risk factors of infections by multiresistant bacteria in cirrhosis: A prospective study. Hepatology. 55(5):1551–61.
Fernández J, Prado V, Trebicka J, Amoros A, Gustot T, Wiest R, Deulofeu C, Garcia E, Acevedo J, Fuhrmann V, et al. 2019. Multidrug-resistant bacterial infections in patients with decompensated cirrhosis and with acute-on-chronic liver failure in europe. J Hepatol. 70(3):398–411.
Fernández J, Piano S, Bartoletti M, Wey EQ. 2021. Management of bacterial and fungal infections in cirrhosis: The MDRO challenge. J Hepatol. 75:S101–17.
Fischer P, Grigoras C, Bugariu A, Nicoara-Farcau O, Stefanescu H, Benea A, Hadade A, Margarit S, Sparchez Z, Tantau M, et al. 2019. Are presepsin and resistin better markers for bacterial infection in patients with decompensated liver cirrhosis? Dig Liver Dis. 51(12):1685–91.
Gairing SJ, Müller L, Kloeckner R, Galle PR, Labenz C. 2022. Review article: post‐TIPSS hepatic encephalopathy—current knowledge and future perspectives. Aliment Pharmacol Ther. 55(10):1265–76.
Gairing SJ, Mangini C, Zarantonello L, Gioia S, Nielsen EJ, Danneberg S, Gabriel M, Ehrenbauer AF, Bloom PP, Ripoll C, et al. 2023. Prevalence of minimal hepatic encephalopathy in patients with liver cirrhosis: A multicenter study. Am J Gastroenterol. 118(12):2191–200.
Gairing SJ, Mangini C, Zarantonello L, Jonasson E, Dobbermannn H, Sultanik P, Galle PR, Labenz J, Thabut D, Marquardt JU, et al. 2024. Proton pump inhibitor use and risk of hepatic encephalopathy: A multicenter study. JHEP Rep. 6(8):101104.
Gallego-Durán R, Hadjihambi A, Ampuero J, Rose CF, Jalan R, Romero-Gómez M. 2024. Ammonia-induced stress response in liver disease progression and hepatic encephalopathy. Nat Rev Gastroenterol Hepatol. (11):774-791
García-Pagán JC, Caca K, Bureau C, Laleman W, Appenrodt B, Luca A, Abraldes JG, Nevens F, Vinel JP, Mössner J, et al. 2010. Early use of TIPS in patients with cirrhosis and variceal bleeding. N Engl J Med. 362(25):2370–9.
García-Pagán JC, Saffo S, Mandorfer M, Garcia-Tsao G. 2020. Where does TIPS fit in the management of patients with cirrhosis? JHEP Rep. 2(4):100122.
Garcia-Tsao G, Abraldes JG. 2021. Nonselective beta-blockers in compensated cirrhosis: Preventing variceal hemorrhage or preventing decompensation? Gastroenterology. 161(3):770–3.
Garcia-Tsao G, Abraldes JG, Rich NE, Wong VW. 2024. AGA clinical practice update on the use of vasoactive drugs and intravenous albumin in cirrhosis: Expert review. Gastroenterology. 166(1):202–10.
Garnacho-Montero J, Fernández-Mondéjar E, Ferrer-Roca R, Herrera-Gutiérrez ME, Lorente JA, Ruiz-Santana S, Artigas A. 2015. Crystalloids and colloids in critical patient resuscitation. Med Intensiva. 39(5):303–15.
Ge PS, Runyon BA. 2014. When should the β-blocker window in cirrhosis close? Gastroenterology. 146(7):1597–9.
Gerbes AL, Labenz J, Appenrodt B, Dollinger M, Gundling F, Gülberg V, Holstege A, Lynen-Jansen P, Steib CJ, Trebicka J, et al. 2019. Updated S2k-guideline "complications of liver cirrhosis". german society of gastroenterology (DGVS). Z Gastroenterolog. 57(5):611.
Ginés P, Quintero E, Arroyo V, Terés J, Bruguera M, Rimola A, Caballería J, Rodés J, Rozman C. 1987. Compensated cirrhosis: Natural history and prognostic factors. Hepatology. 7(1):122–8.
Ginès P, Titó L, Arroyo V, Planas R, Panés J, Viver J, Torres M, Humbert P, Rimola A, Llach J, et al. 1988. Randomized comparative study of therapeutic paracentesis with and without intravenous albumin in cirrhosis. Gastroenterology. 94(6):1493–502.
Ginés P, Rimola A, Planas R, Vargas V, Marco F, Almela M, Forne M, Miranda ML, Llach J, Salmerón JM, et al. 1990. Norfloxacin prevents spontaneous bacterial peritonitis recurrence in cirrhosis : Results of a double - blind, placebo controlled trial. Hepatology. 12(4):716–24.
Girardi P, Buono R, Bisazza C, Marchi L, Angeli P, Di Pascoli M. 2024. Prognostic value of procalcitonin in patients with cirrhosis hospitalized for acute infection. Dig Liver Dis. 56(5):810–7.
Gluud LL, Vilstrup H, Morgan MY. 2016. Non‐absorbable disaccharides versus placebo/no intervention and lactulose versus lactitol for the prevention and treatment of hepatic encephalopathy in people with cirrhosis. Cochrane Database Syst Rev. 2016(5):CD003044.
Gluud LL, Dam G, Les I, Marchesini G, Borre M, Aagaard NK, Vilstrup H, Gluud LL. 2017. Branched‐chain amino acids for people with hepatic encephalopathy. Cochrane Database Syst Rev. 2020(3):CD001939.
Goh ET, Stokes CS, Sidhu SS, Vilstrup H, Gluud LL, Morgan MY, Morgan MY. 2018. L‐ornithine l‐aspartate for prevention and treatment of hepatic encephalopathy in people with cirrhosis. Cochrane Database Syst Rev. 2019(6):CD012410.
Grady K, Gowda S, Kingah P, Soubani AO. 2015. Coil embolization of pulmonary arteries as a palliative treatment of diffuse type I hepatopulmonary syndrome. Respir Care. 60(2):e20–5.
Graham DY, Smith JL. 1981. The course of patients after variceal hemorrhage. Gastroenterology. 80(4):800–9.
Griemsmann M, Grote-Koska D, Cornberg M, Schmidt JJ, Maasoumy B, Book T, Bremer B, Schulte B, Manns MP, Wedemeyer H, et al. 2022. Plasma and ascites pharmacokinetics of meropenem in patients with decompensated cirrhosis and spontaneous bacterial peritonitis. J Hepatol. 76(1):230–3.
Groszmann RJ, Garcia-Tsao G, Bosch J, Grace ND, Burroughs AK, Planas R, Escorsell A, Garcia-Pagan JC, Patch D, Matloff DS, et al. 2005. Beta-blockers to prevent gastroesophageal varices in patients with cirrhosis. N Engl J Med. 353(21):2254–61.
Gu W, Hortlik H, Erasmus H, Schaaf L, Zeleke Y, Uschner FE, Ferstl P, Schulz M, Peiffer K, Queck A, et al. 2022. Trends and the course of liver cirrhosis and its complications in germany: Nationwide population-based study (2005 to 2018). Lancet Reg Health Eur. 12:100240.
Guarner C, Solà R, Soriano G, Andreu M, Novella MT, Vila MC, Sàbat M, Coll S, Ortiz J, Gómez C, et al. 1999. Risk of a first community-acquired spontaneous bacterial peritonitis in cirrhotics with low ascitic fluid protein levels. Gastroenterology. 117(2):414–9.
Guevara M, Terra C, Nazar A, Solà E, Fernández J, Pavesi M, Arroyo V, Ginès P. 2012. Albumin for bacterial infections other than spontaneous bacterial peritonitis in cirrhosis. A randomized, controlled study. J Hepatol. 57(4):759–65.
Gulyás M, Kaposi AD, Elek G, Szollár LG, Hjerpe A. 2001. Value of carcinoembryonic antigen (CEA) and cholesterol assays of ascitic fluid in cases of inconclusive cytology. J Clin Pathol. 54(11):831–5.
Gustot T, Fernandez J, Garcia E, Morando F, Caraceni P, Alessandria C, Laleman W, Trebicka J, Elkrief L, Hopf C, et al. 2015. Clinical course of acute‐on‐chronic liver failure syndrome and effects on prognosis. Hepatology. 62(1):243–52.
Hasa E, Hartmann P, Schnabl B. 2022. Liver cirrhosis and immune dysfunction. Int Immunol. 34(9):455–66.
Hassanein TI, Tofteng F, Brown RS, McGuire B, Lynch P, Mehta R, Larsen FS, Gornbein J, Stange J, Blei AT. 2007. Randomized controlled study of extracorporeal albumin dialysis for hepatic encephalopathy in advanced cirrhosis. Hepatology. 46(6):1853–62.
Hey P, Chapman B, Wong D, Gow P, Testro A, Terbah R, Sinclair M. 2023. Transjugular intrahepatic portosystemic shunt insertion improves muscle mass but not muscle function or frailty measures. Eur J Gastroenterol Hepatol. 35(9):997–1003.
Hillert A, Schultalbers M, Tergast TL, Vonberg R, Rademacher J, Wedemeyer H, Cornberg M, Ziesing S, Maasoumy B, Höner zu Siederdissen C. 2021. Antimicrobial resistance in patients with decompensated liver cirrhosis and bacterial infections in a tertiary center in northern germany. BMC Gastroenterol. 21(1):1–296.
Hirode G, Vittinghoff E, Wong RJ. 2019. Increasing burden of hepatic encephalopathy among hospitalized adults: An analysis of the 2010–2014 national inpatient sample. Dig Dis Sci. 64(6):1448–57.
Homann C, Varming K, Høgåsen K, Mollnes TE, Graudal N, Thomsen AC, Garred P. 1997. Acquired C3 deficiency in patients with alcoholic cirrhosis predisposes to infection and increased mortality. Gut. 40(4):544–9.
Hou M, Lin H, Liu T, Kuo BI, Lee F, Chang F, Lee S. 2004. Antibiotic prophylaxis after endoscopic therapy prevents rebleeding in acute variceal hemorrhage: A randomized trial. Hepatology. 39(3):746–53.
Huelin P, Piano S, Solà E, Stanco M, Solé C, Moreira R, Pose E, Fasolato S, Fabrellas N, de Prada G, et al. 2017. Validation of a staging system for acute kidney injury in patients with cirrhosis and association with acute-on-chronic liver failure. Clin Gastroenterol and Hepatol. 15(3):438,445.e5.
Hui Y, Wang H, Guo G, Yang W, Wang X, Cui B, Fan X, Sun C. 2024. Health-related quality of life and frailty in liver cirrhosis. BMJ Support Palliat Care. 14(e3):e2880-e2887.
Humbert M, Kovacs G, Hoeper MM, Badagliacca R, Berger RMF, Brida M, Carlsen J, Coats AJS, Escribano-Subias P, Ferrari P, et al. 2023. 2022 ESC/ERS guidelines for the diagnosis and treatment of pulmonary hypertension. Eur Respir J. 61(1):2200879.
Huonker M, Schumacher YO, Ochs A, Sorichter S, Keul J, Rössle M. 1999. Cardiac function and haemodynamics in alcoholic cirrhosis and effects of the transjugular intrahepatic portosystemic stent shunt. Gut. 44(5):743–8.
Israelsen M, Dahl EK, Madsen BS, Wiese S, Bendtsen F, Møller S, Fialla AD, Jensen BL, Krag A. 2020. Dobutamine reverses the cardio-suppressive effects of terlipressin without improving renal function in cirrhosis and ascites: A randomized controlled trial. Am J Physiol Gastrointest Liver Physiol. 318(2):G313–21.
Jachs M, Hartl L, Schaufler D, Desbalmes C, Simbrunner B, Eigenbauer E, Bauer DJM, Paternostro R, Schwabl P, Scheiner B, et al. 2021. Amelioration of systemic inflammation in advanced chronic liver disease upon beta-blocker therapy translates into improved clinical outcomes. Gut. 70(9):1758–67.
Jachs M, Hartl L, Simbrunner B, Bauer D, Paternostro R, Scheiner B, Balcar L, Semmler G, Stättermayer AF, Pinter M, et al. 2023. The sequential application of baveno VII criteria and VITRO score improves diagnosis of clinically significant portal hypertension. Clin Gastroenterol and Hepatol. 21(7):1854,1863.e10.
Jachs M, Hartl L, Simbrunner B, Semmler G, Balcar L, Hofer BS, Schwarz M, Bauer D, Stättermayer AF, Pinter M, et al. 2024a. Prognostic performance of non-invasive tests for portal hypertension is comparable to that of hepatic venous pressure gradient. J Hepatol. 80(5):744–52.
Jachs M, Sandmann L, Hartl L, Tergast T, Schwarz M, Bauer DJM, Balcar L, Ehrenbauer A, Hofer BS, Cornberg M, et al. 2024b. Validation of baveno VII criteria and other non-invasive diagnostic algorithms for clinically significant portal hypertension in hepatitis delta. J Hepatol. 81(2):248-257.
Jain A, Sharma BC, Mahajan B, Srivastava S, Kumar A, Sachdeva S, Sonika U, Dalal A. 2022. L‐ornithine l‐aspartate in acute treatment of severe hepatic encephalopathy: A double‐blind randomized controlled trial. Hepatology. 75(5):1194–203.
Jalan R, D’Amico G, Trebicka J, Moreau R, Angeli P, Arroyo V. 2021. New clinical and pathophysiological perspectives defining the trajectory of cirrhosis. J Hepatol. 75:S14–26.
Jalan R, Fernandez J, Wiest R, Schnabl B, Moreau R, Angeli P, Stadlbauer V, Gustot T, Bernardi M, Canton R, et al. 2014a. Bacterial infections in cirrhosis: A position statement based on the EASL special conference 2013. J Hepatol. 60(6):1310–24.
Jalan R, Saliba F, Pavesi M, Amoros A, Moreau R, Ginès P, Levesque E, Durand F, Angeli P, Caraceni P, et al. 2014b. Development and validation of a prognostic score to predict mortality in patients with acute-on-chronic liver failure. J Hepatol. 61(5):1038–47.
Jansson-Knodell CL, Calderon G, Weber R, Ghabril M. 2021. Small intestine varices in cirrhosis at a high-volume liver transplant center: A retrospective database study and literature review. Am J Gastroenterol. 116(7):1426–36.
Jepsen P, Ott P, Andersen PK, Sørensen HT, Vilstrup H. 2010. Clinical course of alcoholic liver cirrhosis: A danish population‐based cohort study. Hepatology. 51(5):1675–82.
Kabelitz MA, Hartl L, Schaub G, Tiede A, Rieland H, Kornfehl A, Hübener P, Jachs M, Hinrichs J, Schütte SL, et al. 2025. Identification of optimal portal pressure decrease to control ascites while minimizing hepatic encephalopathy after TIPS: A multicenter study. Hepatology. Epub ahead of print.
Kang SH, Lee YB, Lee J‐, Nam JY, Chang Y, Cho H, Yoo J‐, Cho YY, Cho EJ, Yu SJ, et al. 2017. Rifaximin treatment is associated with reduced risk of cirrhotic complications and prolonged overall survival in patients experiencing hepatic encephalopathy. Aliment Pharmacol Ther. 46(9):845–55.
Kawaguchi T, Taniguchi E, Sata M. 2013. Effects of oral branched-chain amino acids on hepatic encephalopathy and outcome in patients with liver cirrhosis. Nutr Clin Pract. 28(5):580–8.
Kawut SM, Krowka MJ, Trotter JF, Roberts KE, Benza RL, Badesch DB, Taichman DB, Horn EM, Zacks S, Kaplowitz N, et al. 2008. Clinical risk factors for portopulmonary hypertension. Hepatology. 48(1):196–203.
Ke Q, Wang Z, Huang X, Li L, Wu W, Qiu L, Jiao Y, Xie Y, Peng X, Liu J, et al. 2022. Splenic vein embolization as a feasible treatment for patients with hepatic encephalopathy related to large spontaneous splenorenal shunts. Ann Hepatol. 27(5):100725.
Kim JJ, Tsukamoto MM, Mathur AK, Ghomri YM, Hou LA, Sheibani S, Runyon BA. 2014. Delayed paracentesis is associated with increased in-hospital mortality in patients with spontaneous bacterial peritonitis. Am J Gastroenterol. 109(9):1436–42.
Kim SG, Kim TY, Sohn JH, Um SH, Seo YS, Baik SK, Kim MY, Jang JY, Jeong SW, Lee B, et al. 2016. A randomized, multi-center, open-label study to evaluate the efficacy of carvedilol vs. propranolol to reduce portal pressure in patients with liver cirrhosis. Am J Gastroenterol. 111(11):1582–90.
Kimmann M, Tergast TL, Schultalbers M, Laser H, Gerbel S, Manns MP, Cornberg M, Maasoumy B. 2019. Sustained impact of nosocomial-acquired spontaneous bacterial peritonitis in different stages of decompensated liver cirrhosis. PloS One. 14(8):e0220666.
Klein LM, Chang J, Gu W, Manekeller S, Jansen C, Lingohr P, Praktiknjo M, Kalf JC, Schulz M, Spengler U, et al. 2020. The development and outcome of Acute‐on‐Chronic liver failure after surgical interventions. Liver Transpl. 26(2):227–37.
Kochar N, Tripathi D, McAvoy NC, Ireland H, Redhead DN, Hayes PC. 2008. Bleeding ectopic varices in cirrhosis: The role of transjugular intrahepatic portosystemic stent shunts. Aliment Pharmacol Ther. 28(3):294–303.
Kornfehl A, Tiede A, Hemetsberger P, Kappel J, Müllner-Bucsics T, Stockhoff L, Rieland H, Reider L, Dominik N, Kramer G, et al. 2024. Decreasing interleukin-6 levels after TIPS predict outcomes in decompensated cirrhosis. JHEP Rep. 101308.
Kovalak M, MD, Lake J, MD, Mattek N, MPH, Eisen, Glenn, MD, MPH, Lieberman D, MD, Zaman, Atif, MD, MPH. 2007. Endoscopic screening for varices in cirrhotic patients: Data from a national endoscopic database. Gastrointest Endosc. 65(1):82–8.
Krag M, Marker S, Perner A, Wetterslev J, Wise M, Schefold JC, Keus F, Guttormsen AB, Bendel S, Borthwick M, et al. 2018. Pantoprazole in patients at risk for gastrointestinal bleeding in the ICU. N Engl J Med. 379(23):2199-2208.
Krowka MJ, Plevak DJ, Findlay JY, Rosen CB, Wiesner RH, Krom RAF. 2000. Pulmonary hemodynamics and perioperative cardiopulmonary-related mortality in patients with portopulmonary hypertension undergoing liver transplantation. Liver Transpl. 6(4):443–50.
Krowka MJ, Swanson KL, Frantz RP, McGoon MD, Wiesner RH. 2006. Portopulmonary hypertension: Results from a 10-year screening algorithm. Hepatology. 44(6):1502–10.
Kumar M, Venishetty S, Jindal A, Bihari C, Maiwall R, Vijayaraghavan R, Saggere Muralikrishna S, Arora V, Kumar G, Sarin SK. 2024. Tranexamic acid in upper gastrointestinal bleed in patients with cirrhosis: A randomized controlled trial. Hepatology. 80(2):376-388.
Kumar R, Kerbert AJC, Sheikh MF, Roth N, Calvao JAF, Mesquita MD, Barreira AI, Gurm HS, Ramsahye K, Mookerjee RP, et al. 2021. Determinants of mortality in patients with cirrhosis and uncontrolled variceal bleeding. J Hepatol. 74(1):66–79.
Labenz C, Beul L, Toenges G, Schattenberg JM, Nagel M, Sprinzl MF, Nguyen-Tat M, Zimmermann T, Huber Y, Marquardt JU, et al. 2019. Validation of the simplified animal naming test as primary screening tool for the diagnosis of covert hepatic encephalopathy. Eur J Intern Med. 60:96–100.
Labenz C, Gairing SJ, Kaps L, Ehrenbauer AF, Schleicher EM, Mengel S, Egge JFM, Gabriel MM, Galle PR, Wedemeyer H, et al. 2024. QuickStroop for screening for minimal hepatic encephalopathy in patients with liver cirrhosis. JHEP Rep. 101298.
Laleman W, Simon‐Talero M, Maleux G, Perez M, Ameloot K, Soriano G, Villalba J, Garcia‐Pagan J, Barrufet M, Jalan R, et al. 2013. Embolization of large spontaneous portosystemic shunts for refractory hepatic encephalopathy: A multicenter survey on safety and efficacy. Hepatology. 57(6):2448–57.
Lange CM, Trebicka J, Gerbes A, Canbay A, Geier A, Merle U, Peck‐Radosavljevic M, Tacke F, Vogelmann T, Theis S, et al. 2023. Limited access to liver transplantation and TIPS despite high mortality, healthcare resource use and costs of cirrhosis in germany. Liver Int. 43(11):2503–12.
Larrue H, D’Amico G, Olivas P, Lv Y, Bucsics T, Rudler M, Sauerbruch T, Hernandez-Gea V, Han G, Reiberger T, et al. 2023. TIPS prevents further decompensation and improves survival in patients with cirrhosis and portal hypertension in an individual patient data meta-analysis. J Hepatol. 79(3):692–703.
Lau JYW, Yu Y, Tang RSY, Chan HCH, Yip H, Chan SM, Luk SWY, Wong SH, Lau LHS, Lui RN, et al. 2020. Timing of endoscopy for acute upper gastrointestinal bleeding. N Engl J Med. 382(14):1299–308.
Lebrec D, Giuily N, Hadengue A, Vilgrain V, Moreau R, Poynard T, Gadano A, Lassen C, Benhamou JP, Erlinger S. 1996. Transjugular intrahepatic portosystemic shunts: Comparison with paracentesis in patients with cirrhosis and refractory ascites: A randomized trial. french group of clinicians and a group of biologists. J Hepatol. 25(2):135–44.
Leithead JA, Rajoriya N, Tehami N, Hodson J, Gunson BK, Tripathi D, Ferguson JW. 2015. Non-selective [beta]-blockers are associated with improved survival in patients with ascites listed for liver transplantation. Gut. 64(7):1111.
Levacher S, Blaise M, Pourriat J, Letoumelin P, Lapandry C, Pateron D. 1995. Early administration of terlipressin plus glyceryl trinitrate to control active upper gastrointestinal bleeding in cirrhotic patients. Lancet. 346(8979):865–8.
Lin CH, Shih FY, Ma MH, Chiang WC, Yang CW, Ko PC. 2005. Should bleeding tendency deter abdominal paracentesis? Dig Liver Dis. 37(12):946–51.
Llach J, Rimola A, Navasa M, Ginès P, Salmerón JM, Ginès A, Arroyo V, Rodés J. 1992. Incidence and predictive factors of first episode of spontaneous bacterial peritonitis in cirrhosis with ascites: Relevance of ascitic fluid protein concentration. Hepatology. 16(3):724–7.
Llorente C, Jepsen P, Inamine T, Wang L, Bluemel S, Wang HJ, Loomba R, Bajaj JS, Schubert ML, Sikaroodi M, et al. 2017. Gastric acid suppression promotes alcoholic liver disease by inducing overgrowth of intestinal enterococcus. Nat Commun. 8(1):837–15.
Lo G, Chen W, Wang H, Lee C. 2010. Controlled trial of ligation plus nadolol versus nadolol alone for the prevention of first variceal bleeding. Hepatology. 52(1):230–7.
Lungren MP, MD, Kim CY, MD, Stewart JK, MD, Smith TP, MD, Miller MJ, MD. 2013. Tunneled peritoneal drainage catheter placement for refractory ascites: Single-center experience in 188 patients. J Vasc Interv Radiol. 24(9):1303–8.
Lv X, Lu Q, Deng K, Yang J, Yang L. 2024. Prevalence and characteristics of covert/minimal hepatic encephalopathy in patients with liver cirrhosis: A systematic review and meta-analysis. Am J Gastroenterol. 119(4):690–9.
Lv Y, Chen H, Luo B, Bai W, Li K, Wang Z, Xia D, Guo W, Wang Q, Li X, et al. 2022. Concurrent large spontaneous portosystemic shunt embolization for the prevention of overt hepatic encephalopathy after TIPS: A randomized controlled trial. Hepatology. 76(3):676–88.
Macken L, Hashim A, Mason L, Verma S. 2019. Permanent indwelling peritoneal catheters for palliation of refractory ascites in end‐stage liver disease: A systematic review. Liver Int. 39(9):1594–607.
Maharshi S, Sharma BC, Srivastava S, Jindal A. 2015. Randomised controlled trial of lactulose versus rifaximin for prophylaxis of hepatic encephalopathy in patients with acute variceal bleed. Gut. 64(8):1341–2.
Maiwall R, Kumar A, Pasupuleti SSR, Hidam AK, Tevethia H, Kumar G, Sahney A, Mitra LG, Sarin SK. 2022. A randomized-controlled trial comparing 20% albumin to plasmalyte in patients with cirrhosis and sepsis-induced hypotension [ALPS trial]. J Hepatol. 77(3):670–82.
Maleux G, Indesteege I, Laenen A, Verslype C, Vergote I, Prenen H. 2016. Tenckhoff tunneled peritoneal catheter placement in the palliative treatment of malignant ascites: Technical results and overall clinical outcome. Radiol Oncol. 50(1):1–7.
Mallet M, Rudler M, Thabut D. 2017. Variceal bleeding in cirrhotic patients. Gastroenterol Rep. 5(3):185–92.
Mandorfer M, Bota S, Schwabl P, Bucsics T, Pfisterer N, Kruzik M, Hagmann M, Blacky A, Ferlitsch A, Sieghart W, et al. 2014. Nonselective β blockers increase risk for hepatorenal syndrome and death in patients with cirrhosis and spontaneous bacterial peritonitis. Gastroenterology. 146(7):1680,1690.e1.
Mandorfer M, Simbrunner B. 2021. Prevention of first decompensation in advanced chronic liver disease. Clin Liver Dis. 25(2):291–310.
Martin ED, Berg T, Berenguer M, Burra P, Fondevila C, Heimbach JK, Pageaux G, Sanchez-Fueyo A, Toso C. 2024. EASL clinical practice guidelines on liver transplantation. J Hepatol. 81(6):1040–86.
Mauz JB, Schneider H, Berliner D, Tiede A, Stockhoff L, Hinrichs JB, Wedemeyer H, Meyer BC, Olsson KM, Maasoumy B, et al. 2024. High prevalence and clinical relevance of intrapulmonary vascular dilatations in patients undergoing TIPS implantation. Clin Gastroenterol Hepatol. 22(9):1867-1877.e4.
Merli M, Nicolini G, Angeloni S, Gentili F, Attili AF, Riggio O. 2004. The natural history of portal hypertensive gastropathy in patients with liver cirrhosis and mild portal hypertension. Am J Gastroenterol. 99(10):1959–65.
Merli M, Berzigotti A, Zelber-Sagi S, Dasarathy S, Montagnese S, Genton L, Plauth M, Parés A. 2019. EASL clinical practice guidelines on nutrition in chronic liver disease. J Hepatol. 70(1):172–93.
Merli M, Lucidi C, Di Gregorio V, Lattanzi B, Giannelli V, Giusto M, Farcomeni A, Ceccarelli G, Falcone M, Riggio O, et al. 2016. An empirical broad spectrum antibiotic therapy in health‐care–associated infections improves survival in patients with cirrhosis: A randomized trial. Hepatology. 63(5):1632–9.
Montagnese S, Rautou P, Romero-Gómez M, Larsen FS, Shawcross DL, Thabut D, Vilstrup H, Weissenborn K. 2022. EASL clinical practice guidelines on the management of hepatic encephalopathy. J Hepatol. 77(3):807–24.
Mookerjee RP, Pavesi M, Thomsen KL, Mehta G, Macnaughtan J, Bendtsen F, Coenraad M, Sperl J, Gines P, Moreau R, et al. 2016. Treatment with non-selective beta blockers is associated with reduced severity of systemic inflammation and improved survival of patients with acute-on-chronic liver failure. J Hepatol. 64(3):574–82.
Moreau R, Jalan R, Gines P, Pavesi M, Angeli P, Cordoba J, Durand F, Gustot T, Saliba F, Domenicali M, et al. 2013. Acute-on-chronic liver failure is a distinct syndrome that develops in patients with acute decompensation of cirrhosis. Gastroenterology. 144(7):1426,1437.e9.
Moreau R, Elkrief L, Bureau C, Perarnau J, Thévenot T, Saliba F, Louvet A, Nahon P, Lannes A, Anty R, et al. 2018. Effects of long-term norfloxacin therapy in patients with advanced cirrhosis. Gastroenterology. 155(6):1816,1827.e9.
Moreau R, Tonon M, Krag A, Angeli P, Berenguer M, Berzigotti A, Fernandez J, Francoz C, Gustot T, Jalan R, et al. 2023. EASL clinical practice guidelines on acute-on-chronic liver failure. J Hepatol. 79(2):461–91.
Mücke MM, Rumyantseva T, Mücke VT, Schwarzkopf K, Joshi S, Kempf VAJ, Welsch C, Zeuzem S, Lange CM. 2018. Bacterial infection‐triggered acute‐on‐chronic liver failure is associated with increased mortality. Liver Int. 38(4):645–53.
Mücke MM, Mücke VT, Graf C, Schwarzkopf KM, Ferstl PG, Fernandez J, Zeuzem S, Trebicka J, Lange CM, Herrmann E. 2020a. Efficacy of norfloxacin prophylaxis to prevent spontaneous bacterial peritonitis: A systematic review and meta-analysis. Clin Transl Gastroenterol. 11(8):e00223.
Mücke MM, Mayer A, Kessel J, Mücke VT, Bon D, Schwarzkopf K, Rüschenbaum S, Queck A, Göttig S, Vermehren A, et al. 2020b. Quinolone and multidrug resistance predicts failure of antibiotic prophylaxis of spontaneous bacterial peritonitis. Clin Infect Dis. 70(9):1916–24.
Nadim MK, Kellum JA, Forni L, Francoz C, Asrani SK, Ostermann M, Allegretti AS, Neyra JA, Olson JC, Piano S, et al. 2024. Acute kidney injury in patients with cirrhosis: Acute disease quality initiative (ADQI) and international club of ascites (ICA) joint multidisciplinary consensus meeting. J Hepatol. 81(1):163–83.
Nakagawara A, Inokuchi K, Ikeda K, Kumashiro R, Tamada R. 1984. Decreased superoxide (O2-)-generating activity of blood monocytes from patients with hepatic cirrhosis. Hepatogastroenterology. 31(5):201–3.
Nardelli S, Gioia S, Pasquale C, Pentassuglio I, Farcomeni A, Merli M, Salvatori FM, Nikolli L, Torrisi S, Greco F, et al. 2016. Cognitive impairment predicts the occurrence of hepatic encephalopathy after transjugular intrahepatic portosystemic shunt. Am J Gastroenterol. 111(4):523–8.
Nardelli S, Riggio O, Marra F, Gioia S, Saltini D, Bellafante D, Adotti V, Guasconi T, Ridola L, Rosi M, et al. 2024. Episodic overt hepatic encephalopathy after transjugular intrahepatic portosystemic shunt does not increase mortality in patients with cirrhosis. J Hepatol. 80(4):596–602.
Neuhofer W, Gülberg V, Gerbes AL. 2006. Endothelin and endothelin receptor antagonism in portopulmonary hypertension. Eur J Clin Invest. 36(s3):54–61.
Nicoară-Farcău O, Rudler M, Angrisani D, Torres F, Casanovas G, Bosch J, Lv Y, Thabut D, Fan D, García-Pagán JC, et al. 2021. Effects of early placement of transjugular portosystemic shunts in patients with high-risk acute variceal bleeding: A meta-analysis of individual patient data. Gastroenterology. 160(1):193,205.e10.
Norton ID, Andrews JC, Kamath PS. 1998. Management of ectopic varices. Hepatology. 28(4):1154–8.
Odriozola A, Puente Á, Cuadrado A, Iruzubieta P, Arias‐Loste MT, Redondo C, Rivas C, Fábrega E, Crespo J, Fortea JI. 2023. High accuracy of spleen stiffness measurement in diagnosing clinically significant portal hypertension in metabolic‐associated fatty liver disease. Liver Int. 43(7):1446–57.
Paquet KJ. 1982. Prophylactic endoscopic sclerosing treatment of the esophageal wall in varices - A prospective controlled randomized trial. Endoscopy. 14(1):4–5.
Park WB, Lee K, Lee CS, Jang HC, Kim HB, Lee H, Oh M, Choe KW. 2005. Production of C-reactive protein in escherichia coli-infected patients with liver dysfunction due to liver cirrhosis. Diagn Microbiol Infect Dis. 51(4):227–30.
Peña Rodríguez M, Fagan A, Sikaroodi M, Gillevet PM, Bajaj JS. 2024. Proton pump inhibitor use and complications of cirrhosis are linked with distinct gut microbial bacteriophage and eukaryotic viral-like particle signatures in cirrhosis. Clin Transl Gastroenterol. 15(2):e00659.
Pereira K, Carrion AF, Salsamendi J, Doshi M, Baker R, Kably I. 2016. Endovascular management of refractory hepatic encephalopathy complication of transjugular intrahepatic portosystemic shunt (TIPS): Comprehensive review and clinical practice algorithm. Cardiovasc Intervent Radiol. 39(2):170–82.
Piano S, Fasolato S, Salinas F, Romano A, Tonon M, Morando F, Cavallin M, Gola E, Sticca A, Loregian A, et al. 2016. The empirical antibiotic treatment of nosocomial spontaneous bacterial peritonitis: Results of a randomized, controlled clinical trial. Hepatology. 63(4):1299–309.
Piano S, Singh V, Caraceni P, Maiwall R, Alessandria C, Fernandez J, Soares EC, Kim DJ, Kim SE, Marino M, et al. 2019. Epidemiology and effects of bacterial infections in patients with cirrhosis worldwide. Gastroenterology. 156(5):1368,1380.e10.
Piecha F, Vonderlin J, Frühhaber F, Graß J, Ozga A, Harberts A, Benten D, Hübener P, Reeh M, Riedel C, et al. 2024. Preoperative TIPS and in-hospital mortality in patients with cirrhosis undergoing surgery. JHEP Rep. 6(1):100914.
Planas R, Ballesté B, Antonio Álvarez M, Rivera M, Montoliu S, Anton Galeras J, Santos J, Coll S, Maria Morillas R, Solà R. 2004. Natural history of decompensated hepatitis C virus-related cirrhosis. A study of 200 patients. J Hepatol. 40(5):823–30.
Pons M, Augustin S, Scheiner B, Guillaume M, Rosselli M, Rodrigues SG, Stefanescu H, Ma MM, Mandorfer M, Mergeay-Fabre M, et al. 2021. Noninvasive diagnosis of portal hypertension in patients with compensated advanced chronic liver disease. Am J Gastroenterol. 116(4):723–32.
Porres-Aguilar M, Altamirano JT, Torre-Delgadillo A, Charlton MR, Duarte-Rojo A. 2012. Portopulmonary hypertension and hepatopulmonary syndrome: A clinician-oriented overview. Eur Respir Rev. 21(125):223–33.
Pose E, Piano S, Juanola A, Ginès P. 2024. Hepatorenal syndrome in cirrhosis. Gastroenterology. 166(4):588,604.e1.
Praktiknjo M, Simón-Talero M, Römer J, Roccarina D, Martínez J, Lampichler K, Baiges A, Low G, Llop E, Maurer MH, et al. 2020a. Total area of spontaneous portosystemic shunts independently predicts hepatic encephalopathy and mortality in liver cirrhosis. J Hepatol. 72(6):1140–50.
Praktiknjo M, Simón-Talero M, Römer J, et al. 2020b. Total area of spontaneous portosystemic shunts independently predicts hepatic encephalopathy and mortality in liver cirrhosis. J Hepatol. 72(6):1140-1150.
Praktiknjo M, Abu-Omar J, Chang J, Thomas D, Jansen C, Kupczyk P, Schepis F, Garcia-Pagan JC, Merli M, Meyer C, et al. 2021a. Controlled underdilation using novel VIATORR® controlled expansion stents improves survival after transjugular intrahepatic portosystemic shunt implantation. JHEP Rep. 3(3):100264.
Praktiknjo M, Abu-Omar J, Chang J, et al. 2021b. Controlled underdilation using novel VIATORR® controlled expansion stents improves survival after transjugular intrahepatic portosystemic shunt implantation. JHEP Rep. 3(3):100264.
Privitera G, Figorilli F, Jalan R, Mehta G. 2018. Portosystemic shunt embolization and recurrent ascites: A single-center case series. Gastroenterology. 155(5):1649–50.
Puente A, Hernández-Gea V, Graupera I, Roque M, Colomo A, Poca M, Aracil C, Gich I, Guarner C, Villanueva C. 2014. Drugs plus ligation to prevent rebleeding in cirrhosis: An updated systematic review. Liver Int. 34(6):823–33.
Qiu H, Wander P, Bernstein D, Satapathy SK. 2020. Acute on chronic liver failure from novel severe acute respiratory syndrome coronavirus 2 (SARS‐CoV‐2). Liver Int. 40(7):1590–3.
Queck A, Schwierz L, Gu W, Ferstl PG, Jansen C, Uschner FE, Praktiknjo M, Chang J, Brol MJ, Schepis F, et al. 2023. Targeted decrease of portal hepatic pressure gradient improves ascites control after TIPS. Hepatology. 77(2):466–75.
Raevens S BM, Fallon MB. 2022. Hepatopulmonary syndrome JHEP Rep. 4(9):100527.
Rahimi RS, Singal AG, Cuthbert JA, Rockey DC. 2014. Lactulose vs polyethylene glycol 3350-electrolyte solution for treatment of overt hepatic encephalopathy: The HELP randomized clinical trial. JAMA Intern Med. 174(11):1727–33.
Redfield R, Latt N, Munoz SJ. 2024. Minimal hepatic encephalopathy. Clin Liver Dis. 28(2):237-252.
Reiberger T, Ferlitsch A, Payer BA, Mandorfer M, Heinisch BB, Hayden H, Lammert F, Trauner M, Peck-Radosavljevic M, Vogelsang H. 2013a. Non-selective betablocker therapy decreases intestinal permeability and serum levels of LBP and IL-6 in patients with cirrhosis. J Hepatol. 58(5):911–21.
Reiberger T, Ulbrich G, Ferlitsch A, Payer BA, Schwabl P, Pinter M, Heinisch BB, Trauner M, Kramer L, Peck-Radosavljevic M. 2013b. Carvedilol for primary prophylaxis of variceal bleeding in cirrhotic patients with haemodynamic non-response to propranolol. Gut. 62(11):1634–41.
Reiniš J, Petrenko O, Simbrunner B, Hofer BS, Schepis F, Scoppettuolo M, Saltini D, Indulti F, Guasconi T, Albillos A, et al. 2023. Assessment of portal hypertension severity using machine learning models in patients with compensated cirrhosis. J Hepatol. 78(2):390–400.
Reuken PA, Pletz MW, Baier M, Pfister W, Stallmach A, Bruns T. 2012. Emergence of spontaneous bacterial peritonitis due to enterococci - risk factors and outcome in a 12-year retrospective study. Aliment Pharmacol Ther. 35(10):1199–208.
Reverter E, Tandon P, Augustin S, Turon F, Casu S, Bastiampillai R, Keough A, Llop E, González A, Seijo S, et al. 2014. A MELD-based model to determine risk of mortality among patients with acute variceal bleeding. Gastroenterology. 146(2):412,419.e3.
Ripoll C, Groszmann R, Garcia–Tsao G, Grace N, Burroughs A, Planas R, Escorsell A, Garcia–Pagan JC, Makuch R, Patch D, et al. 2007. Hepatic venous pressure gradient predicts clinical decompensation in patients with compensated cirrhosis. Gastroenterology. 133(2):481–8.
Rose CF, Amodio P, Bajaj JS, Dhiman RK, Montagnese S, Taylor-Robinson SD, Vilstrup H, Jalan R. 2020. Hepatic encephalopathy: Novel insights into classification, pathophysiology and therapy. J Hepatol. 73(6):1526–47.
Runyon BA. 1986. Low-protein-concentration ascitic fluid is predisposed to spontaneous bacterial peritonitis. Gastroenterology. 91(6):1343–6.
Runyon BA, Montano AA, Akriviadis EA, Antillon MR, Irving MA, McHutchison JG. 1992. The serum-ascites albumin gradient is superior to the exudate-transudate concept in the differential diagnosis of ascites. Ann Intern Med. 117(3):215–20.
Salerno F, Borroni G, Moser P, Badalamenti S, Cassara L, Maggio A, Fusini M, Cesana B. 1993. Survival and prognostic factors of cirrhotic patients with ascites: A study of 134 outpatients. Am J Gastroenterol. 88(4):514–9.
Salerno F, Cammà C, Enea M, Rössle M, Wong F. 2007. Transjugular intrahepatic portosystemic shunt for refractory ascites: A meta-analysis of individual patient data. Gastroenterology. 133(3):825–34.
Salerno F, Navickis RJ, Wilkes MM. 2013. Albumin infusion improves outcomes of patients with spontaneous bacterial peritonitis: A meta-analysis of randomized trials. Clin Gastroenterol Hepatol. 11(2):123,130.e1.
Sandmann L, Tergast TL, Wedemeyer H, Deterding K, Maasoumy B. 2023. 3P and 5P models of limited value for the detection of clinically significant portal hypertension in patients with hepatitis delta. J Hepatol. 79(1):e47–9.
Santos J, Planas R, Pardo A, Durández R, Cabré E, Morillas RM, Granada ML, Jiménez JA, Quintero E, Gassull MA. 2003. Spironolactone alone or in combination with furosemide in the treatment of moderate ascites in nonazotemic cirrhosis. A randomized comparative study of efficacy and safety. J Hepatol. 39(2):187–92.
Sarin SK, Lahoti D, Saxena SP, Murthy NS, Makwana UK. 1992. Prevalence, classification and natural history of gastric varices: A long-term follow-up study in 568 portal hypertension patients. Hepatology. 16(6):1343–9.
Sato S, Sato S, Tsuzura H, Ikeda Y, Hayashida S, Takahashi S, Amano N, Murata A, Shimada Y, Iijima K, et al. 2020. Elevated serum procalcitonin levels and their association with the prognosis of patients with liver cirrhosis. Eur J Gastroenterol Hepatol. 32(9):1222–8.
Sauerbruch T, Mengel M, Dollinger M, Zipprich A, Rössle M, Panther E, Wiest R, Caca K, Hoffmeister A, Lutz H, et al. 2015. Prevention of rebleeding from esophageal varices in patients with cirrhosis receiving small-diameter stents versus hemodynamically controlled medical therapy. Gastroenterology. 149(3):660,668.e1.
Saunders JB, Walters JR, Davies AP, Paton A. 1981. A 20-year prospective study of cirrhosis. Br Med J. 282(6260):263–6.
Savale L, Guimas M, Ebstein N, Fertin M, Jevnikar M, Renard S, Horeau-Langlard D, Tromeur C, Chabanne C, Prevot G, et al. 2020. Portopulmonary hypertension in the current era of pulmonary hypertension management. J Hepatol. 73(1):130–9.
Schepis F, Vizzutti F, Garcia-Tsao G, Marzocchi G, Rega L, De Maria N, Di Maira T, Gitto S, Caporali C, Colopi S, et al. 2018. Under-dilated TIPS associate with efficacy and reduced encephalopathy in a prospective, non-randomized study of patients with cirrhosis. Clin Gastroenterol Hepatol. 16(7):1153,1162.e7.
Schneider H, Berliner D, Stockhoff L, Reincke M, Mauz JB, Meyer B, Bauersachs J, Wedemeyer H, Wacker F, Bettinger D, et al. 2023. Diastolic dysfunction is associated with cardiac decompensation after transjugular intrahepatic portosystemic shunt in patients with liver cirrhosis. United European Gastroenterol J. 11(9):837–51.
Schultalbers M, Tergast TL, Simon N, Kabbani A, Kimmann M, zu Siederdissen CH, Gerbel S, Manns MP, Cornberg M, Maasoumy B. 2020. Frequency, characteristics and impact of multiple consecutive nosocomial infections in patients with decompensated liver cirrhosis and ascites. United European Gastroenterol J. 8(5):567–76.
Schulz M, Trebicka J. 2022. Acute-on-chronic liver failure: A global disease. Gut. 71(1):5–6.
Schulz MS, Angeli P, Trebicka J. 2024. Acute and non-acute decompensation of liver cirrhosis (47/130). Liver Int. Epub ahead of print.
Schütte A, Ciesek S, Wedemeyer H, Lange CM. 2019. Influenza virus infection as precipitating event of acute-on-chronic liver failure. J Hepatol. 70(4):797–9.
Schütte SL, Wedemeyer H, Maasoumy B, Tergast TL. 2024. Silver-coating of tunneled peritoneal drainage system is associated with a lower incidence of spontaneous bacterial peritonitis and device explanation. J Hepatol. 80:S202–3.
Semmler G, Binter T, Kozbial K, Schwabl P, Hametner‐Schreil S, Zanetto A, Gavasso S, Chromy D, Bauer DJM, Simbrunner B, et al. 2021. Noninvasive risk stratification after HCV eradication in patients with advanced chronic liver disease. Hepatology. 73(4):1275–89.
Semmler G, Lens S, Meyer EL, Baiges A, Alvardo-Tapias E, Llop E, Tellez L, Schwabl P, Mauro E, Escudé L, et al. 2022. Non-invasive tests for clinically significant portal hypertension after HCV cure. J Hepatol. 77(6):1573–85.
Semmler G, Hartl L, Mendoza YP, Simbrunner B, Jachs M, Balcar L, Schwarz M, Hofer BS, Fritz L, Schedlbauer A, et al. 2024. Simple blood tests to diagnose compensated advanced chronic liver disease and stratify the risk of clinically significant portal hypertension. Hepatology. 80(4):887-900.
Sersté T, Melot C, Francoz C, Durand F, Rautou P, Valla D, Moreau R, Lebrec D. 2010. Deleterious effects of beta‐blockers on survival in patients with cirrhosis and refractory ascites. Hepatology. 52(3):1017–22.
Shah HA, Azam Z, Rauf J, Abid S, Hamid S, Jafri W, Khalid A, Ismail FW, Parkash O, Subhan A, et al. 2014. Carvedilol vs. esophageal variceal band ligation in the primary prophylaxis of variceal hemorrhage: A multicentre randomized controlled trial. J Hepatol. 60(4):757–64.
Shaheen A, Nguyen HH, Congly SE, Kaplan GG, Swain MG. 2019. Nationwide estimates and risk factors of hospital readmission in patients with cirrhosis in the united states. Liver Int. 39(5):878–84.
Shaheen NJ, Stuart E, Schmitz SM, Mitchell KL, Fried MW, Zacks S, Russo MW, Galanko J, Shresta R. 2005. Pantoprazole reduces the size of postbanding ulcers after variceal band ligation: A randomized, controlled trial. Hepatology. 41(3):588–94.
Sharma BC, Sharma P, Agrawal A, Sarin SK. 2009. Secondary prophylaxis of hepatic encephalopathy: An open-label randomized controlled trial of lactulose versus placebo. Gastroenterology. 137(3):885,891.e1.
Sharma BC, Sharma P, Lunia MK, Srivastava S, Goyal R, Sarin SK. 2013. A randomized, double-blind, controlled trial comparing rifaximin plus lactulose with lactulose alone in treatment of overt hepatic encephalopathy. Am J Gastroenterol. 108(9):1458–63.
Sharma P, Agrawal A, Sharma BC, Sarin SK. 2011. Prophylaxis of hepatic encephalopathy in acute variceal bleed: A randomized controlled trial of lactulose versus no lactulose. J Gastroenterol Hepatol. 26(6):996–1003.
Shawcross DL, Wright GA, Stadlbauer V, Hodges SJ, Davies NA, Wheeler-Jones C, Pitsillides AA, Jalan R. 2008. Ammonia impairs neutrophil phagocytic function in liver disease. Hepatology. 48(4):1202-12.
Simbrunner B, Hartl L, Jachs M, Bauer DJM, Scheiner B, Hofer BS, Stättermayer AF, Marculescu R, Trauner M, Mandorfer M, et al. 2023. Dysregulated biomarkers of innate and adaptive immunity predict infections and disease progression in cirrhosis. JHEP Rep. 5(5):100712.
Simonneau G, Montani D, Celermajer DS, Denton CP, Gatzoulis MA, Krowka M, Williams PG, Souza R. 2019. Haemodynamic definitions and updated clinical classification of pulmonary hypertension. Eur Respir J. 53(1):1.
Singh S, Khan A. 2020. Clinical characteristics and outcomes of coronavirus disease 2019 among patients with preexisting liver disease in the united states: A multicenter research network study. Gastroenterology. 159(2):768,771.e3.
Singh V, Ghosh S, Singh B, Kumar P, Sharma N, Bhalla A, Sharma AK, Choudhary NS, Chawla Y, Nain CK. 2012. Noradrenaline vs. terlipressin in the treatment of hepatorenal syndrome: A randomized study. J Hepatol. 56(6):1293–8.
Sola-Vera J, Miñana J, Ricart E, Planella M, González B, Torras X, Rodrı́guez J, Such J, Pascual S, Soriano G, et al. 2003. Randomized trial comparing albumin and saline in the prevention of paracentesis-induced circulatory dysfunction in cirrhotic patients with ascites. Hepatology. 37(5):1147–53.
Solbach P, Höner zu Siederdissen C, Taubert R, Ziegert S, Port K, Schneider A, Hueper K, Manns M, Wedemeyer H, Jaeckel E. 2017. Home-based drainage of refractory ascites by a permanent-tunneled peritoneal catheter can safely replace large-volume paracentesis. Eur J Gastroenterol Hepatol. 29(5):539–46.
Solbach P, Höner zu Siederdissen C, Wellhöner F, Richter N, Heidrich B, Lenzen H, Kerstin P, Hueper K, Manns M, Wedemeyer H, et al. 2018. Automated low-flow ascites pump in a real-world setting: Complications and outcomes. Eur J Gastroenterol Hepatol. 30(9):1082–9.
Solé C, Solà E, Huelin P, Carol M, Moreira R, Cereijo U, Mas J, Graupera I, Pose E, Napoleone L, et al. 2019. Characterization of inflammatory response in hepatorenal syndrome: Relationship with kidney outcome and survival. Liver Int. 39(7):1246–55.
Sørensen M, Andersen JV, Bjerring PN, Vilstrup H. 2024. Hepatic encephalopathy as a result of ammonia-induced increase in GABAergic tone with secondary reduced brain energy metabolism. Metab Brain Dis. 2024;40(1):19.
Sort P, Navasa M, Arroyo V, Aldeguer X, Planas R, Ruiz-del-Arbol L, Castells L, Vargas V, Soriano G, Guevara M, et al. 1999. Effect of intravenous albumin on renal impairment and mortality in patients with cirrhosis and spontaneous bacterial peritonitis. N Engl J Med. 341(6):403–9.
Stirnimann G, Berg T, Spahr L, Zeuzem S, McPherson S, Lammert F, Storni F, Banz V, Babatz J, Vargas V, et al. 2017. Treatment of refractory ascites with an automated low‐flow ascites pump in patients with cirrhosis. Aliment Pharmacol Ther. 46(10):981–91.
Stockhoff L, Schneider H, Tergast TL, Cornberg M, Maasoumy B. 2021. Freiburg index of post-TIPS survival (FIPS) a valid prognostic score in patients with cirrhosis but also an advisor against TIPS? J Hepatol. 75(2):487–9.
Stockhoff L, Muellner‐Bucsics T, Markova AA, Schultalbers M, Keimburg SA, Tergast TL, Hinrichs JB, Simon N, Gerbel S, Manns MP, et al. 2022. Low serum cholinesterase identifies patients with worse outcome and increased mortality after TIPS. Hepatol Commun. 6(3):621–32.
Stokkeland K, Brandt L, Ekbom A, Hultcrantz R. 2006. Improved prognosis for patients hospitalized with esophageal varices in sweden 1969–2002. Hepatology. 43(3):500–5.
Sussman N, Kaza V, Barshes N, Stribling R, Goss J, O'Mahony C, Zhang E, Vierling J, Frost A. 2006. Successful liver transplantation following medical management of portopulmonary hypertension: A Single‐Center series. Am J Transplant. 6(9):2177–82.
Tapper EB, Henderson JB, Parikh ND, Ioannou GN, Lok AS. 2019. Incidence of and risk factors for hepatic encephalopathy in a Population‐Based cohort of americans with cirrhosis. Hepatol Commun. 3(11):1510–9.
Téllez L, Ibáñez-Samaniego L, Pérez del Villar C, Yotti R, Martínez J, Carrión L, Rodríguez de Santiago E, Rivera M, González-Mansilla A, Pastor Ó, et al. 2020. Non-selective beta-blockers impair global circulatory homeostasis and renal function in cirrhotic patients with refractory ascites. J Hepatol. 73(6):1404–14.
Tergast TL, Wranke A, Laser H, Gerbel S, Manns MP, Cornberg M, Maasoumy B. 2018. Dose‐dependent impact of proton pump inhibitors on the clinical course of spontaneous bacterial peritonitis. Liver Int. 38(9):1602–13.
Tergast TL, Kimmann M, Laser H, Gerbel S, Manns MP, Cornberg M, Maasoumy B. 2019. Systemic arterial blood pressure determines the therapeutic window of non‐selective beta blockers in decompensated cirrhosis. Aliment Pharmacol Ther. 50(6):696–706.
Tergast TL, Schultalbers M, Wedemeyer H, Cornberg M, Maasoumy B. 2021. IgG, a novel predictor for acute-on-chronic liver failure and survival in patients with decompensated cirrhosis? J Hepatol. 75(1):229–31.
Tergast TL, Griemsmann M, Stockhoff L, Heidrich B, Schirmer H, Lenzen H, Wedemeyer H, Cornberg M, Jaeckel E, Maasoumy B. 2022. Home‐based, tunnelled peritoneal drainage system as an alternative treatment option for patients with refractory ascites. Aliment Pharmacol Ther. 56(3):529–39.
Tergast TL, Griemsmann M, Stockhoff L, Port K, Heidrich B, Cornberg M, Wedemeyer H, Lenzen H, Richter N, Jaeckel E, et al. 2023. Daily low-volume paracentesis and clinical complications in patients with refractory ascites. JAMA Netw Open. 6(7):e2322048.
Tevethia HV, Pande A, Vijayaraghavan R, Kumar G, Sarin SK. 2024. Combination of carvedilol with variceal band ligation in prevention of first variceal bleed in child-turcotte-pugh B and C cirrhosis with high-risk oesophageal varices: The ‘CAVARLY TRIAL’. Gut. 73(11):1844–53.
Thévenot T, Bureau C, Oberti F, Anty R, Louvet A, Plessier A, Rudler M, Heurgué-Berlot A, Rosa I, Talbodec N, et al. 2015. Effect of albumin in cirrhotic patients with infection other than spontaneous bacterial peritonitis. A randomized trial. J Hepatol. 62(4):822–30.
Thomas C, Glinskii V, de Jesus Perez V, Sahay S. 2020. Portopulmonary hypertension: From bench to bedside. Frontiers in Medicine. 7:569413.
Tiede A, Stockhoff L, Liu Z, Rieland H, Mauz JB, Ohlendorf V, Bremer B, Witt J, Kraft A, Cornberg M, et al. 2024. TIPS insertion leads to sustained reversal of systemic inflammation in patients with decompensated liver cirrhosis. Clin Mol Hepatol. Epub ahead of print.
Titó L, Rimola A, Ginès P, Llach J, Arroyo V, Rodés J. 1988. Recurrence of spontaneous bacterial peritonitis in cirrhosis: Frequency and predictive factors. Hepatology. 8(1):27–31.
Tranah TH, Ballester M, Carbonell-Asins JA, Ampuero J, Alexandrino G, Caracostea A, Sánchez-Torrijos Y, Thomsen KL, Kerbert AJC, Capilla-Lozano M, et al. 2022. Plasma ammonia levels predict hospitalisation with liver-related complications and mortality in clinically stable outpatients with cirrhosis. J Hepatol. 77(6):1554–63.
Trebicka J, Amoros A, Pitarch C, Titos E, Alcaraz-Quiles J, Schierwagen R, Deulofeu C, Fernandez-Gomez J, Piano S, Caraceni P, et al. 2019a. Addressing profiles of systemic inflammation across the different clinical phenotypes of acutely decompensated cirrhosis. Front Immunol. 10:476.
Trebicka J, Bastgen D, Byrtus J, et al. 2019b. Smaller-Diameter Covered Transjugular Intrahepatic Portosystemic Shunt Stents Are Associated With Increased Survival. Clin Gastroenterol Hepatol. 2019;17(13):2793-2799.e1.
Trebicka J, Gu W, Ibáñez-Samaniego L, Hernández-Gea V, Pitarch C, Garcia E, Procopet B, Giráldez Á, Amitrano L, Villanueva C, et al. 2020a. Rebleeding and mortality risk are increased by ACLF but reduced by pre-emptive TIPS. J Hepatol. 73(5):1082–91.
Trebicka J, Fernandez J, Papp M, Caraceni P, Giovo I, Uschner FE, Jimenez C, Gustot T, Albillos A, Bañares R, et al. 2020b. The PREDICT study uncovers three clinical courses of acutely decompensated cirrhosis that have distinct pathophysiology. J Hepatol. 73(4):842–54.
Trebicka J, Sundaram V, Moreau R, Jalan R, Arroyo V. 2020c. Liver transplantation for Acute‐on‐Chronic liver failure: Science or fiction? Liver Transpl. 26(7):906–15.
Trebicka J, Fernandez J, Papp M, et al. 2020d. The PREDICT study uncovers three clinical courses of acutely decompensated cirrhosis that have distinct pathophysiology. J Hepatol. 73(4):842-854.
Trebicka J, Papp M, Caraceni P, Laleman W, Gambino C, Giovo I, Uschner FE, Jansen C, Jimenez C, Mookerjee R, et al. 2021a. PREDICT identifies precipitating events associated with the clinical course of acutely decompensated cirrhosis. J Hepatol. 74(5):1097–108.
Trebicka J, Bork P, Krag A, Arumugam M. 2021b. Utilizing the gut microbiome in decompensated cirrhosis and acute-on-chronic liver failure. Nat Rev Gastroenterol Hepatol. 2021;18(3):167-180.
Trebicka J, Louvet A, Arroyo V, Jalan R, Shah VH, Moreau R. 2022. Severe alcoholic hepatitis as precipitant for organ failure and ACLF. Z Gastroenterol. 60(1):67–76.
Tuifua TS, Partovi S, Remer EM, Ragheb J, Bullen JA, Kattan MW, Kapoor B. 2022. Assessment of clinical outcomes, clinical manifestations, and risk factors for hepatic infarction after transjugular intrahepatic portosystemic shunt placement (TIPS): A retrospective comparative study. Cardiovasc Intervent Radiol. 45(10):1512–23.
Turco L, Reiberger T, Vitale G, La Mura V. 2023. Carvedilol as the new non‐selective beta‐blocker of choice in patients with cirrhosis and portal hypertension. Liver Int. 43(6):1183–94.
Urrunaga, Nathalie H., MD, MS, Rockey DC, MD. 2014. Portal hypertensive gastropathy and colopathy. Clin Liver Dis. 18(2):389–406.
Villa E, Bianchini M, Blasi A, Denys A, Giannini EG, de Gottardi A, Lisman T, de Raucourt E, Ripoll C, Rautou P. 2022. EASL clinical practice guidelines on prevention and management of bleeding and thrombosis in patients with cirrhosis. J Hepatol. 76(5):1151–84.
Villanueva C, Colomo A, Bosch A, Concepción M, Hernandez-Gea V, Aracil C, Graupera I, Poca M, Alvarez-Urturi C, Gordillo J, et al. 2013. Transfusion strategies for acute upper gastrointestinal bleeding. N Engl J Med. 368(1):11–21.
Villanueva C, Albillos A, Genescà J, Garcia-Pagan JC, Calleja JL, Aracil C, Bañares R, Morillas RM, Poca M, Peñas B, et al. 2019. Β blockers to prevent decompensation of cirrhosis in patients with clinically significant portal hypertension (PREDESCI): A randomised, double-blind, placebo-controlled, multicentre trial. Lancet. 393(10181):1597–608.
Villanueva C, Torres F, Sarin SK, Shah HA, Tripathi D, Brujats A, Rodrigues SG, Bhardwaj A, Azam Z, Hayes PC, et al. 2022. Carvedilol reduces the risk of decompensation and mortality in patients with compensated cirrhosis in a competing-risk meta-analysis. J Hepatol. 77(4):1014–25.
Vilstrup H, Amodio P, Bajaj J, Cordoba J, Ferenci P, Mullen KD, Weissenborn K, Wong P. 2014. Hepatic encephalopathy in chronic liver disease: 2014 practice guideline by the american association for the study of liver diseases and the european association for the study of the liver. Hepatology. 60(2):715–35.
Wang J, Yu Y, Li G, Shen C, Meng Z, Zheng J, Jia Y, Chen S, Zhang X, Zhu M, et al. 2018. Relationship between serum HBV-RNA levels and intrahepatic viral as well as histologic activity markers in entecavir-treated patients. J Hepatol. 68(1):16–24.
Wang W, Yang J, Liu C, Song P, Wang W, Xu H, Xia X. 2019. Norfloxacin, ciprofloxacin, trimethoprim–sulfamethoxazole, and rifaximin for the prevention of spontaneous bacterial peritonitis: A network meta-analysis. Eur J Gastroenterol Hepatol. 31(8):905–10.
Weissenborn K, Ennen JC, Schomerus H, Rückert N, Hecker H. 2001. Neuropsychological characterization of hepatic encephalopathy. J Hepatol. 34(5):768–73.
Wellhöner F, Döscher N, Tergast TL, Vital M, Plumeier I, Kahl S, Potthoff A, Manns MP, Maasoumy B, Wedemeyer H, et al. 2019. The impact of proton pump inhibitors on the intestinal microbiota in chronic hepatitis C patients. Scand J Gastroenterol. 54(8):1033–41.
Wong F, Bendel E, Sniderman K, Frederick T, Haskal ZJ, Sanyal A, Asrani SK, Capel J, Kamath PS. 2020. Improvement in quality of life and decrease in Large‐Volume paracentesis requirements with the automated Low‐Flow ascites pump. Liver Transpl. 26(5):651–61.
Wong F, Pappas SC, Curry MP, Reddy KR, Rubin RA, Porayko MK, Gonzalez SA, Mumtaz K, Lim N, Simonetto DA, et al. 2021. Terlipressin plus albumin for the treatment of type 1 hepatorenal syndrome. N Engl J Med. 384(9):818–28.
Wong F, Pappas SC, Reddy KR, Vargas H, Curry MP, Sanyal A, Jamil K. 2022. Terlipressin use and respiratory failure in patients with hepatorenal syndrome type 1 and severe acute‐on‐chronic liver failure. Aliment Pharmacol Ther. 56(8):1284–93.
Yang Y, Li L, Qu C, Zeng B, Liang S, Luo Z, Wang X, Zhong C. 2015. Diagnostic accuracy of serum procalcitonin for spontaneous bacterial peritonitis due to end-stage liver disease: A meta-analysis. Medicine (Baltimore). 94(49):e2077.
Zaka AZ, Mangoura SA, Ahmed MA. 2025. New updates on hepatopulmonary syndrome: A comprehensive review. Respir Med. 236:107911.